Following the recent emerging markets weakness, driven by dollar strength, tighter financial conditions in the US and, in some cases, domestic politics, market watchers are looking at EM assets again.
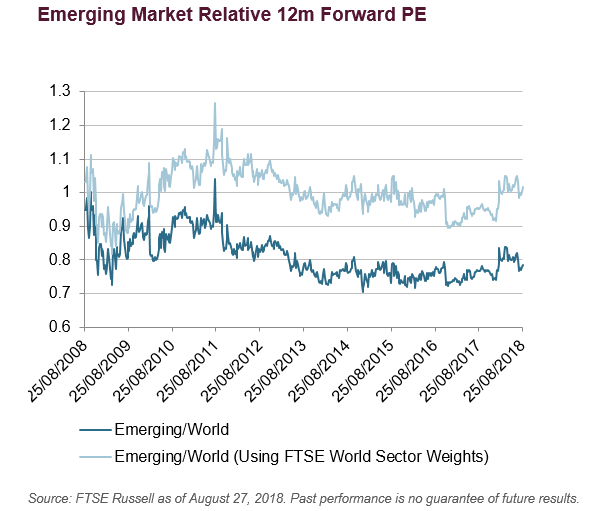
The chart below shows that FTSE EM equities have moved to a c.21% PE ratio discount to FTSE World equities (dark blue line). In P/E terms, FTSE World equities are trading at 15.5x earnings and EM equities at 12.2x.

However, we need to be aware that emerging markets offer different exposure to industry sectors in comparison with developed markets.
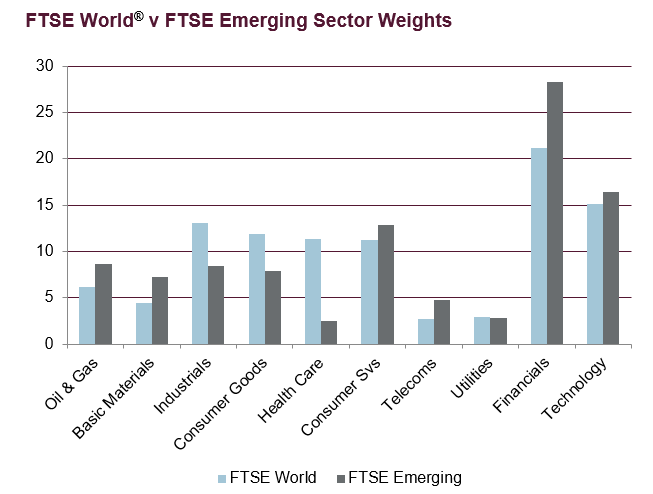
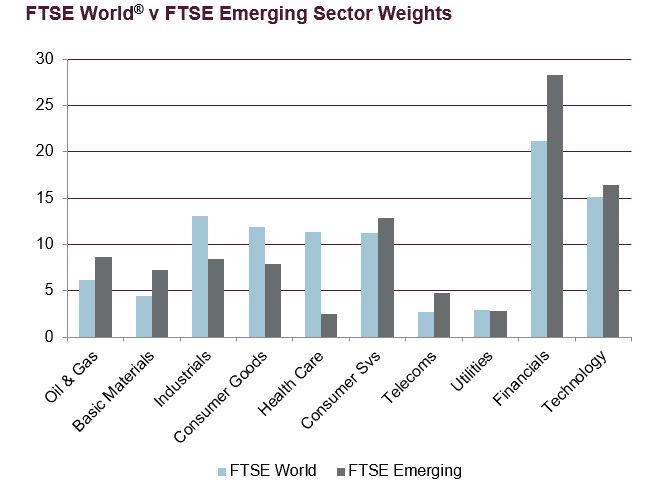
As the chart below shows, FTSE EM is heavily overweight financials, oil & gas and materials, compared with FTSE World.

None of these sectors are much loved and continue to face structural headwinds
Financial stocks have, of course, underperformed since the financial crisis, even in developed markets (investors’ EM-specific concerns include high levels of debt and leverage). Oil & gas have recovered of late, but only after several years of weak performance. And materials stocks face the prospect of weaker demand from China.
Although emerging markets have seen a rapid growth in their technology weighting in recent years, this is somewhat distorted by China’s large tech stocks and is not a reflection of EM as whole.
What happens if you reweight the EM Index to reflect developed market sector exposure?

