
Weekly Market Review – May 21, 2022
Stock Markets
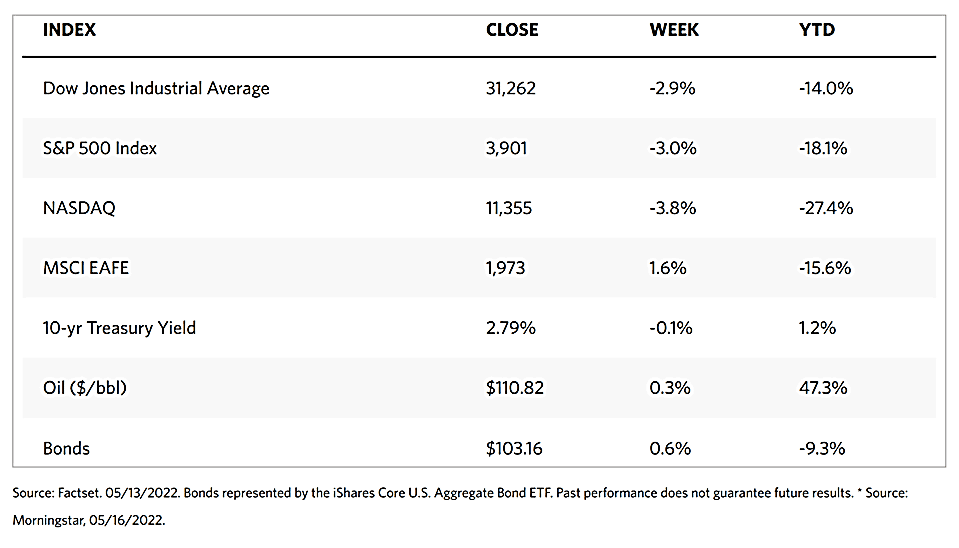
U.S. stock markets are now down for the seventh consecutive week. On Wednesday, equities saw the biggest one-day decline in the history of the S&P 500 index since June 2020. The S&P 500 fell 20.9% from its intraday high last January. Thereby exceeded the technical 20% pullback indicative of a bear market, but barely recovered to close the week down approximately 18% year-to-date. Despite the sell-down, trading was remarkably subdued with volumes more than 10% below recent 20-day averages as well as below every day of the preceding week. The cause for the continued downward pressure was disappointing earnings and revenue results from many of the country’s major retailers which contributed to the broader market pessimism. Most notable was the 25% loss in Target shares after the announcement that the company’s earnings missed estimates by almost a third. The company attributed its underperformance to a combination of reduced sales of discretionary items such as televisions, and higher costs. Also falling short of expectations were earnings results from Lowe’s, Walmart, and Home Depot. Costco shares also suffered a sell-off partly due to rumors that it was increasing the price of its popular café hot dog. Investors also appeared to be concerned that major retailers may be compelled to pass on to their consumers more of their higher input costs in the coming months, maintaining inflation at elevated levels.
U.S. Economy
Although the markets appear to have priced in about a 75% chance that a recession will take place, this does not appear to be a base-case scenario over the next 12 months. Solid economic fundamentals continue to underlie this economy, particularly healthy consumer appetite, a tight labor market with low unemployment, rising wages, and continued corporate earnings growth although the latter will likely remain in the mid-single digits. April retail sales figures released during the past week exceeded expectations, together with industrial production that also expanded at a monthly rate of 1.1%, well above the forecasted 0.4%.
Analysts point to the likelihood that the current pullback is a non-recessionary market correction. Recovery may take some time, however, because of the continuing elevated inflation and increasingly restrictive policies being adopted by the Federal Reserve. On Wednesday, Fed Chair Jerome Powell remarked in an interview that policy formulators will not hesitate to raise rates as much as necessary due to the “unconditional need” to tame inflation, even if it may be viewed as painful by some market players.
Economic data released this past week provided mixed signals concerning an imminent recession, On Tuesday, investors viewed with optimism the news that retail sales, excluding auto sales, rose more than expected in April (0.6% against 0,4%), and March’s gain was revised upward to 2.1%. Also surprisingly exceeding expectations are reports for industrial production, manufacturing production, and capacity utilization.
Metals and Mining
The Federal Reserve is walking a tightrope between ensuring economic growth and controlling inflation. Despite the nervousness among investors, the gold market continues to hold steady in a volatile market. Reports indicate that investors are fleeing equities, as may be seen in the deep dives of stock prices in the past week. In contrast, the gold market is maintaining a neutral stance for the year so far, making it the outperforming asset to date. Federal Reserve Chair Powell points to rocky weeks ahead as he expressed his commitment to bringing inflation down to the extent of adopting more aggressive measures such as increasing interest rates. In light of current developments, the strong U.S. dollar poses greater challenges for the gold market. This past week, however, the price of gold bounced below $1,800 per ounce, indicating that this level provides strong support for the precious metal and that it is again perceived by investors as a safe-haven asset.
Precious metals spot prices strengthened this week with modest gains. Gold prices moved from last week’s close of $1,811.79 to this week’s $1,846.50 per ounce, a gain of 1.92%. Silver, which previously ended at $21.11, landed at this week’s close of $21.78 per ounce, an increase of 3.17%. Platinum also gained, this time by 1.15% from the previous week’s close of $946.30 to this week’s $957.17 per ounce. Palladium rose slightly by 0.96% from the preceding week’s $1,946.30 to the recent close at $1,964.92 per ounce. The 3-month base metal prices also followed precious metals. Copper moved from $9,159.00 to $9,422.00 per metric tonne, an increase of 2.87%. Zinc moved within the week from $3,489.50 to its close at $3,707.00 per metric tonne for a 6.23% appreciation. Aluminum went up from the preceding week’s $2,788.00 close to last week’s $2,946.00 per metric tonne for a 5.67% gain. Tin ascended by 3.88% from $33,370.00 the week before to the recent week’s close at $34,665.00 per metric tonne.
Energy and Oil
During the past weeks, India had been the strongest purchaser of Russian crude oil whose continued transactions gave the markets some reason to believe that Russia may comprehensively pivot towards Asia. This past week, however, China emerged as the country which may give Russia a stronger foothold in the Asian market. Beijing launched direct government-to-government talks concerning the purchase of discounted crude to replenish its strategic stocks. Despite the prospect of an impending Chinese reopening, this news added some downward pressure to oil prices as ICE Brent moved around $112 per barrel by Friday. Concurrently, the European Union launched its $220 billion plan to terminate its reliance on Russian fossil fuels by 2027. The plan calls for investing $120 billion in new renewable energy projects, $30 billion in power grids, and $59 billion in energy savings and heating pumps. In the meantime, the United Nations Secretary-General Antonio Guterres called for all governments to end fossil fuel subsidies, which have risen to $500 billion worldwide. The move was intended to exert pressure on polluting nations ahead of the COP27 climate conference in Egypt that is slated for November of this year.
Natural Gas
This report week, May 11 to May 18, natural gas spot prices rose at most locations. The Henry Hub spot price ascended to $8.45 per million British thermal units (MMBtu) from $7.51/MMBtu. This is the highest daily price since a winter storm accounts for the close to record-high spot prices last seen in February 2021. International spot prices were mixed as LNG cargoes in Asia fell by $0.11/MMBtu to an average of $23.51/MMBtu for the week. At the Title Transfer Facility (TTF) in the Netherlands, the most liquid natural gas spot market in Europe, the day-ahead price rose by $0.10/MMBtu to average at $28.11/MMBtu for the week. By comparison, in the same week last year, the average prices in the TTF and in East Asia were $9.17/MMBtu and $9.48/MMBtu, respectively.
Along the Gulf Coast, prices rose as temperatures remained warmer than normal. Prices in the Midwest increased with the national average as temperatures also rose above normal. As temperature remained moderate, prices across the West followed major hub prices higher. In the Northeast, warmer temperatures moved into the region and cooling demand increased, nudging prices higher. The U.S. natural gas supply decreased slightly week over week, and U.S. natural gas demand fell as temperatures rose across many major metropolitan areas. This week from last week, U.S. LNG exports decreased by two vessels.
World Markets
Amid growing concerns of slowing economic growth and accelerated interest rate increases, shares in Europe pulled back for the week. The pan-European STOXX Europe 600 Index dipped 0.55% in local currency terms. France’s CAC 40 Index gave up 1.22% while Germany’s Xetra DAX slid 0.33%. Italy’s FTSE MIB Index bucked the trend and advance modestly. UK’s FTSE 100 Index absorbed a loss of 0.24%. Core eurozone government bond yields were volatile, ending roughly sideways. Several officials of the European Central Bank (ECB) made some hawkish pronouncements, such as the possibility of a 50-basis point interest rate hike in July, that caused yields to rise early in the week. Subsequently, yields pulled back in light of the weak retail earnings in the U.S. that intensified concerns of an economic slowdown. Peripheral eurozone yields broadly tracked core markets over the week and ended slightly higher. UK gilt yields ascended on the prospect of inflation reaching its highest level in four decades, better-than-expected employment data, and hawkish pronouncements from the Bank of England economist Huw Pill.
Japan’s stock market realized positive returns for the week. The Nikkei 225 Index gained 1.18% while the broader TOPIX Index rose 0.71%. Positive regional sentiment due to China’s action to support its property sector gave investors some buying motivation in the latest of a series of monetary easing measures intended to boost the coronavirus-locked down economy. Also providing some support was the announcement by Japan’s government that its strict border control measures would be further eased. In light of these developments, the yield on the 10-year Japanese government bond descended to 0.23% from the previous week’s 0.24%. The yen gained ground against the U.S. dollar to JPY 127.98 from JPY 129.27 one week earlier. Japan’s economy contracted in the first quarter and consumer price inflation exceeded the Bank of Japan’s 2% target in April.
Chinese stocks climbed higher in response to the interest rate cut announced by the central bank in support of its property sector. The slight gain in equities was welcome despite negative economic data weighing on investors’ sentiment. The broad, capitalization-weighted Shanghai Composite Index gained 2.0% while the blue-chip CSI 300 Index which tracks the largest listed companies in Shanghai and Shenzhen also gained 2.2%. Earlier, the People’s Bank of China (PBOC) reduced the five-year loan prime rate (LPR) by a significantly sizeable 15 basis points to 4.45%. The rate cut followed the move by the PBOC to cut the lower limit of mortgage rates for first-time homebuyers. The rate cuts were a response by the central bank to data indicating that home sales in April plunged. The reduction in the five-year LPR sends the signal that the government seeks to encourage homebuying demand. In the meantime, economic data released during the week points to slowing growth amid pandemic lockdowns. The yield on China’s 10-year government bond moved higher to 2.836% from 2.834% a week earlier. The yuan firmed to 6.68 from 6.80 per U.S. dollar.
The Week Ahead
Economic data expected in the week ahead include the PMI composite, consumer expenditures, and real gross domestic income.
Key Topics to Watch
- S&P Global U.S. manufacturing PMI (flash)
- S&P Global U.S. services PMI (flash)
- New home sales (SAAR)
- Durable goods orders
- Core capital equipment orders
- FOMC minutes
- Initial jobless claims
- Continuing jobless claims
- Real gross domestic product revision (SAAR)
- Real final sales to domestic purchasers revision (SAAR)
- Real gross domestic income (SAAR)
- Pending home sales index
- PCE inflation
- Core PCE inflation
- PCE inflation (year-over-year)
- Core PCE inflation (year-over-year)
- Real disposable income
- Real consumer spending
- Nominal personal income
- Nominal consumer spending
- Advance trade in goods
- UMich consumer sentiment index (final)
- 5-year inflation expectations (final)
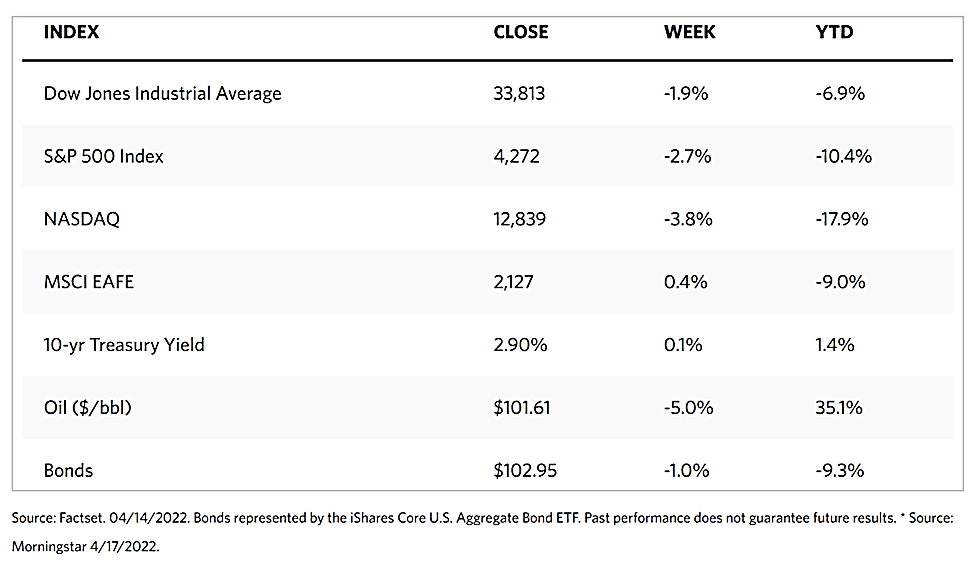
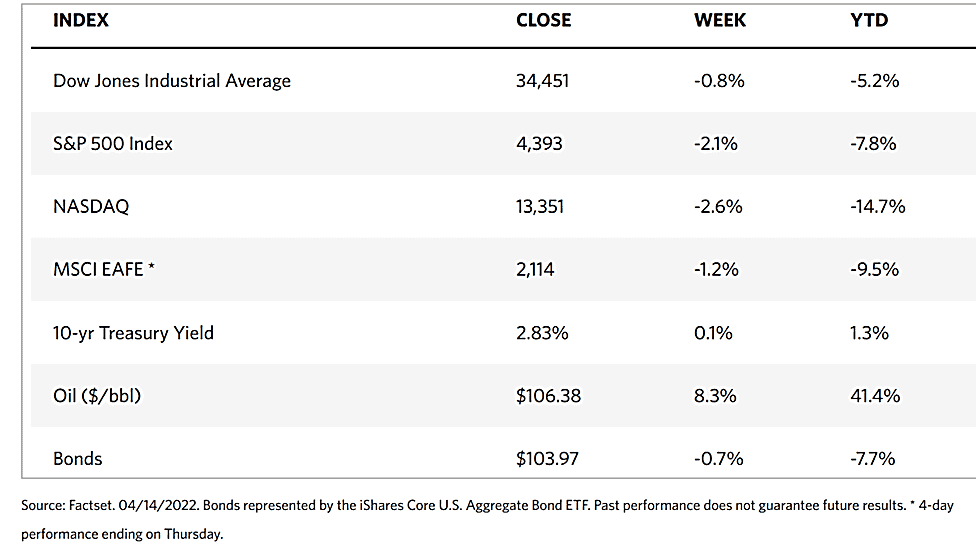
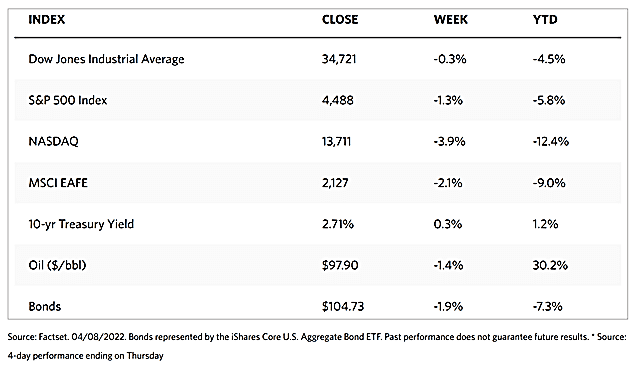
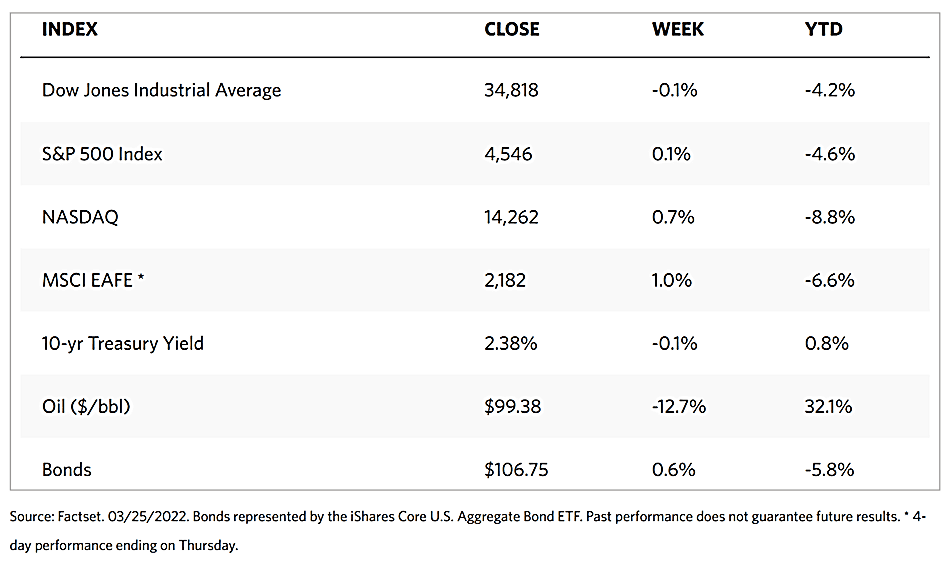
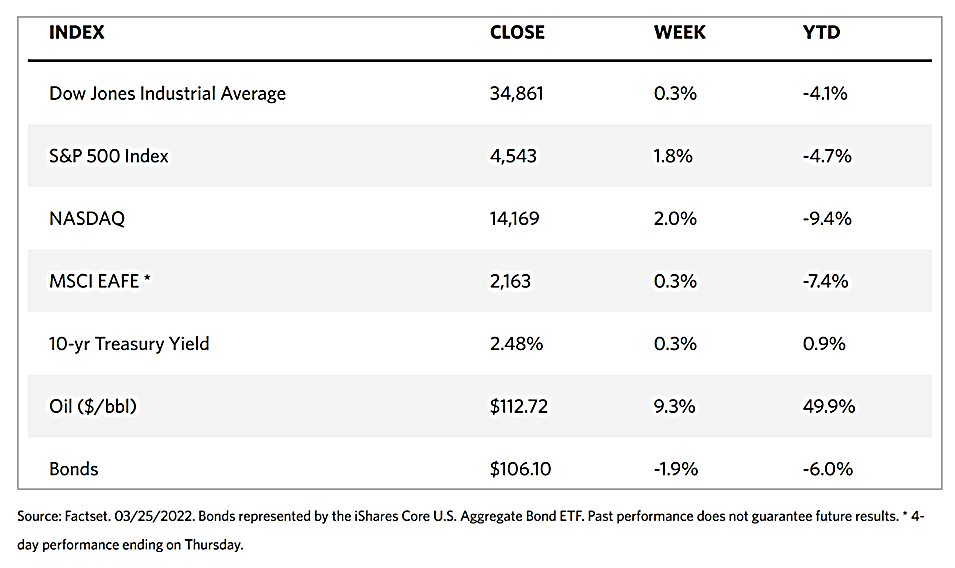
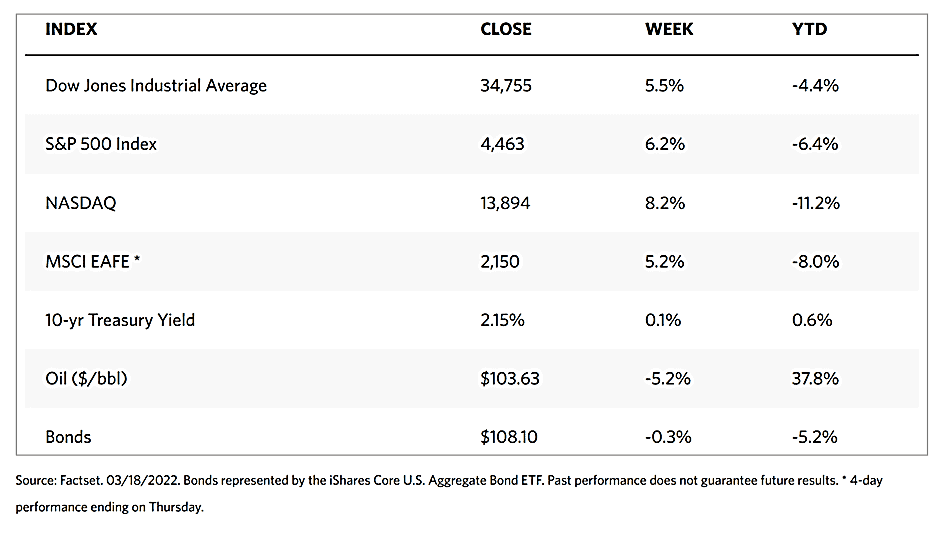
Markets Index Wrap Up