
Stock Markets
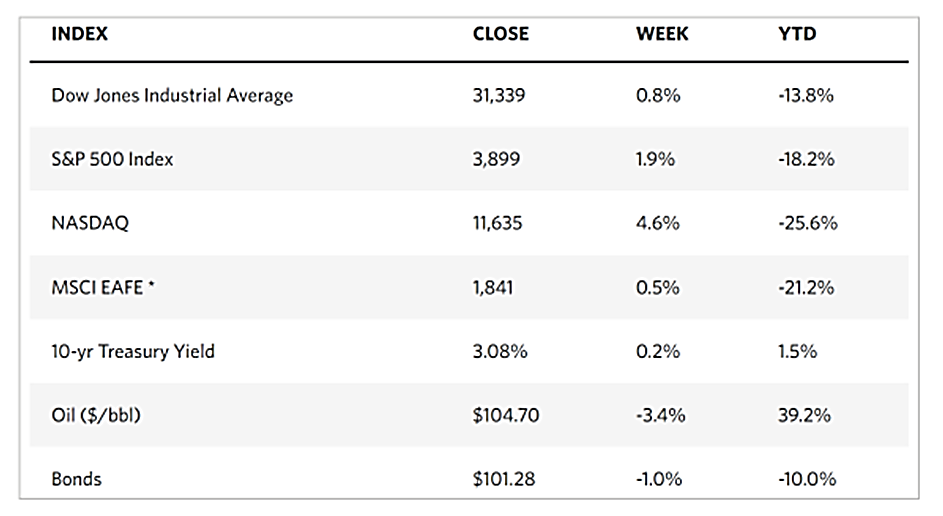
The markets were generally up over the past week. The Dow Jones Industrial Average (DJIA) gained 0.77% from the previous week’s close, while the broader S&P 500 Index rose by 1.94%. The technology tracker Nasdaq Composite rose 4.56%, signaling that most of the rebound took place in the technology sector. Within the Dow Jones, the only sector to pull back was utilities whose average lost 3.08%. The general optimism that reigned this week stemmed from the perception that the Federal Reserve will be able to control inflation without plunging the economy into a recession. The S&P 500 Index gains pulled it out of the bear market such that at Friday’s close of trading it was down only 19.1% from its January peak.
The Nasdaq Composite gained the most among the indexes. This is due to the surge among the large communication services and information technology sectors which, together with consumer discretionary, outperformed the other sectors. On the other hand, the drop in the utilities was the result of a sharp fall in energy shares on Tuesday (the markets were closed on Monday in observance of Independence Day) following the drop in domestic oil prices. Oil fell below $100 per barrel for the first time in almost two months, but it rallied, together with crude prices, later in the week.
U.S. Economy
Last week’s release of economic data dominated investor sentiment as investors struggled to assess the likely repercussions of the currently restrictive Fed policy. On Wednesday, the final estimates of services activity in June were each released by S&P Global and the Institute of Supply Management (ISM), both versions of which came in slightly above the consensus estimate even as they also indicated a continuing slowdown in growth. The measure used by the ISM in its assessment hit its lowest level since June 2020, while its employment metric was well into contraction territory for the third time this year.
The main focus of most analysts, however, revolved around the labor market. Last Friday, the June jobs report released showed that the employment situation is relatively favorable, all else considered. In June 372,000 jobs were added to the economy, raising the three-month average to 375,000, which is inconsistent with a coming recession. Furthermore, the unemployment rate held at 3.6% for the fourth month in a row, which is close to the 50-year low. Again, this does not signal a coming recession, since historically, the unemployment rate has climbed about half a percent before recessions began. The initial jobless claims have inched higher in the past weeks, which may signal some upcoming weakness in hiring trends. At present, however, the job market situation does not appear to support either one side or the other on the recession speculation.
Metals and Mining
The gold market has seen an almost 4% drop since May when it experienced its biggest selloff. Investors are hoping that this recent plunge has shaken out some of the complacent long-term holders that still linger in the marketplace. Many players have been waiting for the shakeout of this overhang supply and are looking forward to adding to their long-term bullish bets. There is, however, the opposing view that this recent drop may just be the beginning of a bigger move as gold faces some major headwinds. The greatest barrier faced by the precious metal is the possibility that the Federal Reserve may continue to aggressively raise interest rates. Investors already anticipate that the Fed may increase interest rates by an additional 75 basis points by the end of July. This expectation has driven the U.S dollar to a 20-year high and pushed bond yields back above 3%. Should this materialize, it would tend to drive gold prices down since gold is a non-yielding asset. On the other hand, it may also make gold more attractive as a safe haven asset.
This past week, gold lost 3.81% of its value, from the previous week’s $1,811.43 to this week’s close at $1,742.48 per troy ounce. Silver descended 2.82% from $19.88 the week earlier to $19.32 per troy ounce this week. Platinum gained slightly from $892.74 to $894.76 per troy ounce for a week-on-week increase of 0.23%. Palladium rose substantially from its previous close at $1,959.58 to this past week’s end at $2,160.96 per troy ounce, a gain of 10.28%. The 3-mo prices of base metals were mixed. Copper began at $8,048.00 and closed the week at $7,805.50 per metric tonne, a loss of -3.01%. Zinc, which ended the previous week at $3,029.00, closed this week at $3,099.00 per metric tonne, for a gain of 2.31%. Aluminum began at $2,444.00 and closed at $2,436.50 per metric tonne, a loss of 0.31%. Tin, which closed a week ago at $26,650.00, closed this week at $25,364.00 per metric tonne, for a weekly loss of 4.83%.
Energy and Oil
The oil price collapse on Tuesday may be one of the oil industry’s most memorable developments of this tumultuous year. It was the third-largest daily loss since the onset of the oil exchanges. Furthermore, declining crude did not impact any changes along the futures curve. The implication is that the large drop in oil price was mainly due to widespread profit-taking. Primarily non-physical participants panicked at the thought of recession descending upon the markets sooner than anticipated. According to the balances, however, the markets are still contending with extremely tight supply. Although it might take some time, the physical side of the scale will likely push prices back soon.
Natural Gas
At most locations this report week, June 29 to July 6, natural gas spot prices fell. The Henry Hub spot price dropped from $6.67 per million British thermal units (MMBtu) at the beginning of the report week to $5.63/MMBtu by the week’s end. International spot prices for natural gas increased, however. The weekly average swap prices for liquefied natural gas (LNG) cargoes in East Asia ascended $1.56 to a weekly average of $38.43/MMBtu. The prices at the Title Transfer Facility (TTF) in the Netherlands, which is Europe’s most liquid natural gas spot market, the day-ahead price increased by $7.62 to a weekly average of $47.99/MMBtu. In the corresponding week last year, (week ended July 7, 2021), the prices in East Asia and at TTF were $13.17/MMBtu and $12.27/MMBtu, respectively. The weekly average premium of TTF prices to East Asia this report week was $9.56/MMBtu, the highest such premium since the second week of March, following Russia’s full-scale invasion of Ukraine.
In the domestic market, prices in the Midwest fell with the national average while prices along the Gulf Coast fell with moderate temperatures. Prices across the West fell as temperatures along the West Coast and across the Rocky Mountains remained moderate. In the Northeast, prices declined ahead of lower temperatures and ample pipeline capacity. The U.S. natural gas supply increased slightly week-over-week while natural gas demand rose as a result of temperature swings across the country. U.S. LNG exports increased by one vessel this week from last week.
World Markets
European shares rallied in the first week of July following three straight months of losses. The gains appear to be restrained, however, by the reimposition of some coronavirus restrictions by China apparently to restrain any further spread of the virus. There were also ongoing worries that further energy shortages may cause a recession in Europe. The pan-European STOXX Europe 600 Index closed the week 2.45% higher in local currency terms. Italy’s FTSE MIB Index gained 1.96%, France’s CAC 40 Index climbed 1.72%, and Germany’s Xetra DAX Index ascended 1.58%. The UK’s FTSE 100 Index added 0.38%. Core eurozone sovereign yields did not change substantially. German bund yields, however, began to climb after better-than-expected employment figures were released in the U.S. on Friday morning. UK gilt rates significantly rose this week.
Japan’s stock markets charted gains during this week. The Nikkei 225 Index rose 2.24% while the broader TOPIX Index gained 2.30%. Regarding the fixed income markets, the yield on the 10-year Japanese government bond (JGB) climbed to 0.24% from 0.23% at the end of the week before. In June, the Bank of Japan (BoJ) established a monthly record in its JGB purchases as it attempted to slow the rise in long-term yields above the 0.25% cap it has set under its policy of yield curve control. The dovish stance of the central bank has created pressure on the yen, which weakened to approximately JPY 135.90 against the U.S. dollar, from FPY 135.22 the prior week, still languishing at its lowest levels in 24 years. The firm commitment of the BoJ to its policy of monetary easing contrasts significantly with the tightening stance of other central banks in the world in their attempts to stem inflation. Although consumer prices have trended upward in Japan, inflation remains low compared with other developed countries.
Chinese stocks pulled back slightly due to concerns about rising coronavirus cases and rising geopolitical tensions. Both the broad, capitalization-weighted Shanghai Composite Index and the blue-chip CSI 300 Index, which tracks the largest listed companies in Shanghai and Shenzhen, lost 1% of their value. China’s coronavirus caseload went up to 478 on Thursday from Wednesday’s 409 count, mostly detected in the eastern province of Anhui. The population of this province that is in lockdown is more than 1 million people located in small towns. In Jiangsu and other provinces, dozens of new cases are also appearing. Shanghai, which just ended a two-months-long lockdown, faces a “relatively high” risk of elevated community COVID-19 transmission, according to health officials on Friday, In geopolitics, Sino-U.S. tensions increased after a senior Chinese military officer warned his U.S. counterpart that any “arbitrary provocations” would be met with a “firm counterstrike” by China. The yuan currency remained steady at CNY 6.70 per U.S. dollar. The 10-year Chinese government bond yield rose slightly to 2.858% from 2.847% one week prior.
The Week Ahead
The CPI index, the PPI index, and initial and continuing jobless claims are among the important economic data expected to be released in the coming week.
Key Topics to Watch
- 3-year inflation expectations
- New York Fed President John Williams discusses move away from LIBOR
- NFIB small business index
- Richmond Fed President Tom Barkin speaks
- Consumer price index (monthly)
- Core CPI (monthly)
- CPI (year-over-year)
- Core CPI (year-over-year)
- Beige book
- Federal budget (comparison vs. year-ago)
- Producer price index final demand (monthly)
- Initial jobless claims
- Continuing jobless claims
- Fed Gov. Chris Waller speaks
- Retail sales
- Retail sales excluding vehicles
- Import price index
- Empire State manufacturing index
- Atlanta Fed President Raphael Bostic speaks
- Industrial production index
- Capacity utilization
- UMich consumer sentiment index (preliminary)
- UMich 5-year inflation expectations
- Business inventories
Markets Index Wrap Up