
Stock Markets
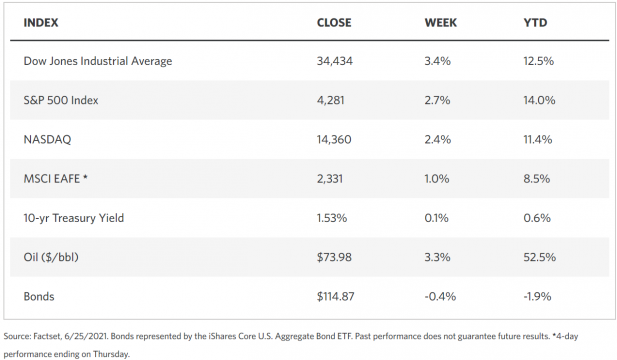
The stock markets rebounded strongly from the decline during the previous week. The broad S&P 500, as well as the technology-dominated Nasdaq Composite Index, ascended to record highs as both experienced their largest weekly gains since the start of April. Although volumes were modest which is typical of summer trading, equities rose steadily for most of the week. The energy sector fared best among the components of the S&P 500 due to the strong price increases among the oil stocks. Oil companies surged to their highest prices since October 2018, mainly due to slackening global inventories. Underperforming the rest of the market were utilities and real estate stocks. Stocks and other sensitive securities also got a boost later in the week from the pronouncement that an agreement had been reached by a group of 10 senators on a bipartisan infrastructure deal roughly in the amount of 1 trillion US dollars. However, the bill has still to be drafted and is expected to face strong resistance from both sides of the aisle.
U.S. Economy
The stellar performance of equities this week appears to indicate that the economic recovery is still going strong, despite the pullback of the previous week. Conditions continue to remain favorable while the growth rate expectedly slows in light of the ground already covered from the low point during the pandemic. There remains no significant change in the outlook of the financial markets as well as the underlying economy. A further driver may be the agreement on the infrastructure deal worth arrived at by a bipartisan group of senators, although it may head into significant resistance as it makes its way through Congress to become a law.
- Economic activity in the private sector is expanding at a fast pace. The preliminary Purchasing Managers’ Index (PMI) for June, which is a leading indicator of economic activity, is signaling that output in the private sector is expanding robustly despite a slight slowdown from the record levels in May. The manufacturing activity index, on the other hand, rose to a level not seen since 2007 when data began to be collected; simultaneously, the services index lost ground and pulled the composite index down with it. It appears that the continued rise in demand since the virus began to subside is spreading out over a broader base to include previously constrained consumer-facing businesses. This suggests that the next phase of the recovery will be driven by increased consumption of service products.
- The results of the annual stress test of the banking sector, which aims to determine the resilience of the large financial institutions under conditions of severe global recession, have been released by the Federal Reserve. All 23 banks subjected to the test passed, signaling that the restrictions on dividends and share repurchases related to the pandemic may already be lifted. Although this news is already anticipated by investors, the financial sector may see a positive reaction due to this outcome.
Metals and Mining
After gold prices plunged in the previous week on the back of inflation rate concerns, the yellow metal moved higher on Friday, its first weekly gain in more than a month. Although gold futures hardly changed, the spot price of gold experienced a week-on-week gain of 0.98%, from $1,764,16 per ounce in the previous week to $1,781.44 in the week just concluded. Silver, palladium, and platinum also rose on higher margins, showing a distinct trend in precious metals. Silver gained 1.20%, moving from $25.79 the week earlier to $26.10 per ounce on Friday. Platinum gained by a significant 6.44%, ending Friday at $1,110.72 from last week’s $1.043.48 per ounce. Palladium gained the most, rising by 6.67% to end at $2.640.45 from the previous week’s $2.475.46 per ounce. Demand for gold increased due to the lower-than-expected inflation rate as the personal consumption expenditure (PCE) price index, the preferred inflation measure by the Fed, fell below expectations in May.
Prices of base metals also showed gains in the just concluded trading week. Copper gained 2.93%, ending Friday at $9,413.50 per tonne from the week-ago close of $9,145.50. The other metals rose even higher. Zinc closed Friday at $2.907.50 from the earlier week’s $2.822.50 per tonne, an increase of 3.01%. Tin ended $30,774 from an earlier $29,862 per tonne, or a rise of 3.05%. But aluminum outperformed the rest, rising by 4.23% from $2,385 to $2,486 per tonne.
Energy and Oil
Oil closed another week of price gains despite the slightly volatile trading this week as OPEC+ prepared to mount a scheduled increase in production. Elsewhere in the world, oil exploration and production appear headed for choppy waters. At home, the federal government indicated that it would support the Line 3 pipeline in Minnesota, and in Europe, Chevron committed not to cut its oil and gas production in contravention of the trend among other European supermajors who are shifting to solar or wind power. British Petroleum (BP) is also decided to continue in the production of oil and gas for the coming decades as it sees benefits in the coming increase in oil prices. BP plans to maintain its oil and gas production even though it may be reducing production volume preparatory to shifting to show carbon energy. Oil output will continue to remain lackluster, however, despite the 400% increase in the number of fracking crews working the U.S. shale patch. Growing demand for oil and gas will continue to push prices upward, with the danger of a supply shortage slowly shaping up.
Natural Gas
U.S. liquid natural gas (LNG) prices are poised to rise despite the expansion of production in this arena. Continued supply of LNG to feed the growing Asian demand has pushed the cost of LNG upwards for U.S. producers this year. According to a Rystad Energy report, the short-run marginal cost of U.S. LND exports to Asia is estimated to increase to about $5.60 per million British thermal units (MMBtu) as of June 2021. This is an increase of 30% from last year’s average of $4.30/MMBtu, and 65%, from $3.4/MMBtu in mid-2020.
At most locations for the report week June 16 to June 23, natural gas spot prices increased. The Henry Hub spot price increased to $3.33/MMBtu by the week’s end from $3.17/MMBtu at the start of the week. The price of the July 2021 New Mercantile Exchange (NYMEX) contract climbed by $0.08 from $3.251/MMBtu to $3.333/MMBtu week-on-week. The price of the 12-month strip averaging July 2021 through June 2022 futures contracts gained $0.05/MMBtu to end at $3.259/MMBtu.
World Markets
The European stock markets gained ground through the week in volatile trading, on the optimism driven by news of a bipartisan agreement that may usher in a one-trillion-dollar U.S. infrastructure spending plan. The pan-European STOXX Europe 600 Index close the week up by 1.23% even as the main stock indexes also registered gains. Italy’s FTSE MIB rose 1.16%, Germany’s Xetra DAX Index gained 1.04%, and France’s CAC 40 increased by 0.82%. The UK’s FTSE 100 Index outperformed the other stock markets, growing by 1.69%. The core eurozone government bond yields closed marginally higher for the week as the German bund tracked Treasury yields and thereafter pushed by strong purchasing manager’s index (PMI) data and robust business confidence indicators. Thereafter, however, the yields corrected in response to cautionary signals from the Bank of England’s (BOE). Peripheral eurozone bond yields were similarly volatile. The UK gilt yields lost some ground as it reacted to the BOE’s pronouncement that near-term inflation strength may be temporary.
In Asia, Japanese equities were off to a rocky start for the week as it precipitously lost ground on the first trading day only to rebound the following day. Investor sentiments thereafter took a downturn when the Federal Reserve announced a possible tapering of its accommodative policies earlier than previously expected. Subsequent reassurances from the central bank that it will maintain its supportive measures towards continued economic recovery restored some stability to the markets. The Nikkei 225 Index rose 0.35% while the TOPIX grew by 0.83% for the week. Also during the week, the Japanese yen weakened against the U.S. dollar to a level it had not seen since March 2020, due to the disappointing domestic economic data. The yield on the Japanese 10-year government bond similarly slid to 0.05%. In the meantime, Japan attained its target of 1 million coronavirus vaccine doses administered per day for the first half of June, slightly ahead of the Prime Minister’s announced expectations.
Robust equities trading brought a gain of 2.7% to China’s large-cap CSI-300 Index while the Shanghai Composite Index climbed 2.3%. The gains ended a three-week-long decline in the Chinese stock markets. The rally was led by financial stocks as the People’s Bank of China (PBoC) released some liquidity into the domestic financial system, the first time it had done so since February this year. Renewable energy companies saw some buying interest from investors after the National Energy Administration of China declared that more than 50% of rooftop spaces on government buildings will be converted to solar panels and a lower target for other buildings such as schools and hospitals. Also seeing gains are domestic leisure and travel stocks on reports that it is unlikely that the country will open its international borders for the rest of the year. The yield on China’s 10-year sovereign bond closed the week at 3.10%, 10 basis points lower. The renminbi had a weak beginning but subsequently rallied to end the week unchanged against the U.S. dollar at RMB 6.453.
The Week Ahead
Among the important economic data scheduled for release in the coming week are the Durable Orders, the Dallas Fed Index, and the unemployment rate.
Key Topics to Watch
- New York Fed President John Williams speaks at BIS panel
- S&P CoreLogic Case Shiller home price index (year-over-year)
- Richmond Fed President Tom Barkin interviewed
- Consumer confidence index
- ADP employment report
- Chicago PMI
- Pending home sales index
- Initial jobless claims (regular state program)
- Continuing jobless claims (regular state program)
- Markit manufacturing PMI (final)
- ISM manufacturing index
- Construction spending
- Motor vehicle sales (SAAR)
- Nonfarm payrolls
- Unemployment rate
- Average hourly earnings
- Trade deficit
- Factory orders
Markets Index Wrap Up