Donald Trump claimed on the campaign trail that, as president, he would completely eliminate the then–$19 trillion in national debt. Let’s just say he’s not exactly on track.
Since he made that promise in early 2016, the debt has ballooned to $21.7 trillion, and his tax cuts are expected to drive that number higher.
But before you jump on the Trump-bashing bandwagon, it might be helpful to see how we got in this debt-riddled position.
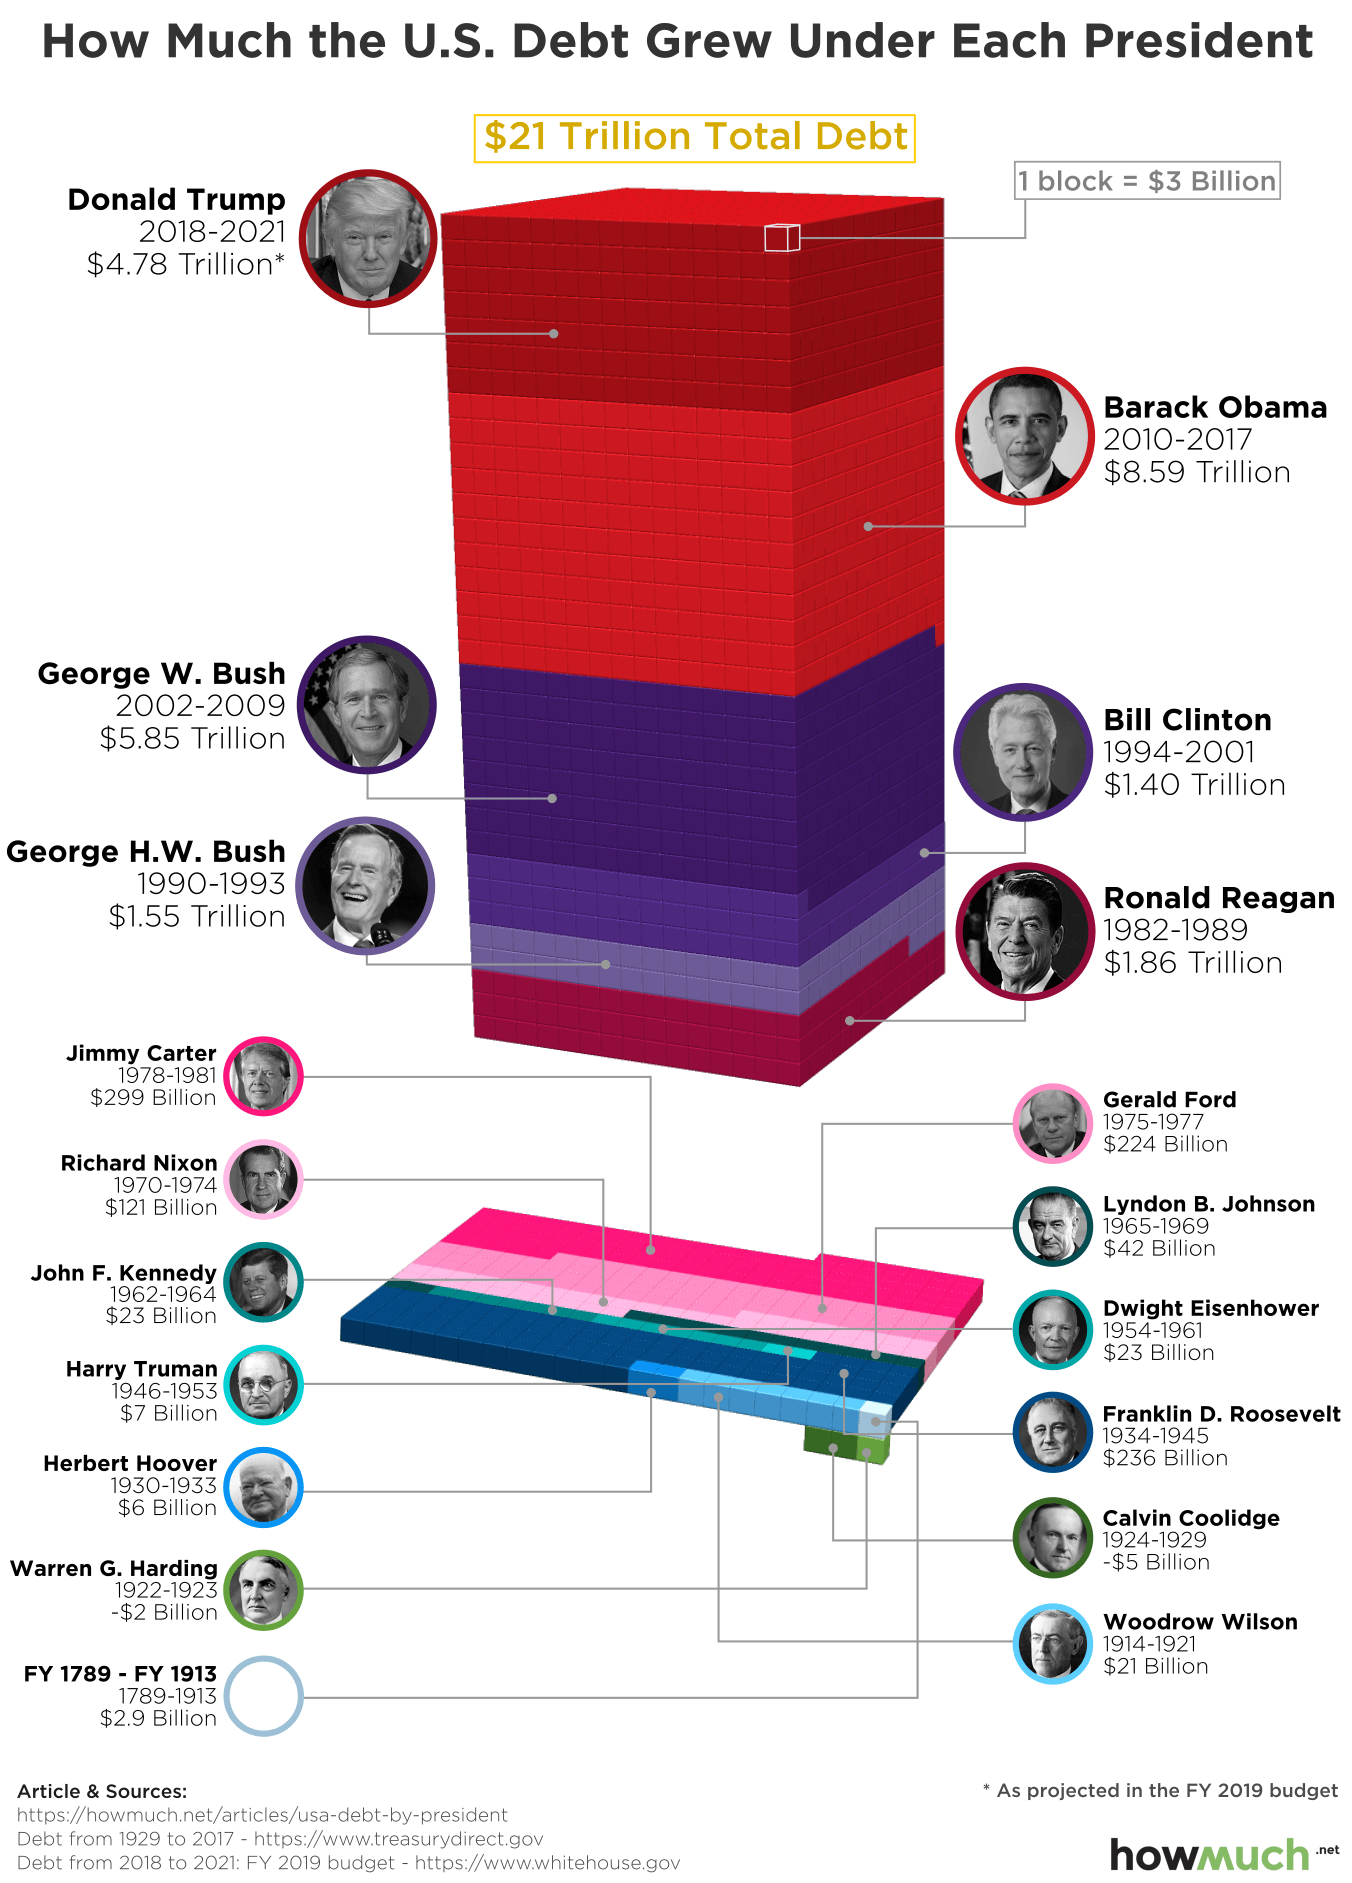
Cost-estimating website HowMuch.net crunched numbers from the U.S. Treasury as well as various data points uncovered by the Balance to come up with this colorful, and very telling, history of America’s debt problem:

Of note, the visual lumps together all the presidents from 1780 to 1913 and uses inflation-adjusted dollars to make a fair comparison.
As you can see, Barack Obama takes the crown with almost $9 trillion added to the heap, though Trump may surpass that by the time he’s done. Percentage-wise, however, Ronald Reagan gets the nod, considering U.S. debt nearly tripled during his terms.
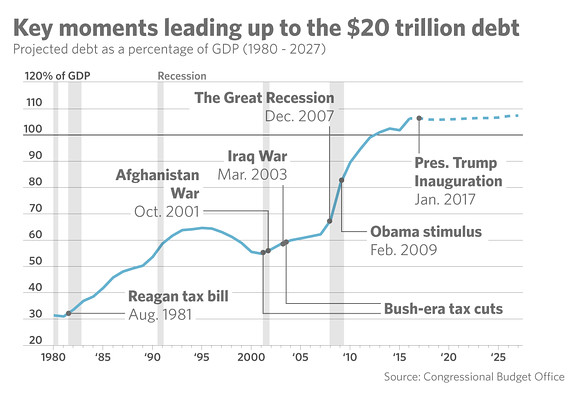
Here’s another look at how we got here from earlier in the year, when the debt first broke the $20 trillion barrier:

It’s not all about the president, of course. He submits the budget, but fiscal policies are ultimately set by Congress. More important, outside factors like downturns and wars obviously make for uneven comparisons.
Dick Cheney once famously said, “Deficits don’t matter.” As it stands now, the country and the economy just keep plugging along even as the debt continues to grow. But how long can that last?
HowMuch.net’s Raul Amoros referred to Earnest Hemingway’s response when asked how he’d gone bankrupt. “Gradually, then suddenly,” the author quipped.

