
Stock Markets
The stock markets moved sideways for the week which was dominated by first-quarter earnings reports and little market-moving economic news. Market volumes were particularly light which underscores the listless trading for the week. First-quarter earnings reports are still coming in, but once the remaining company results have been released, overall earnings for the S&P 500 listed companies will show a decline for the second straight quarter, although some reports have surprised on the upside. During the week, financials outperformed overall despite a quick plunge in Goldman Sachs’s share price after the company missed consensus revenue estimates. Goldman Sachs has diversified into the wealth and asset management businesses.
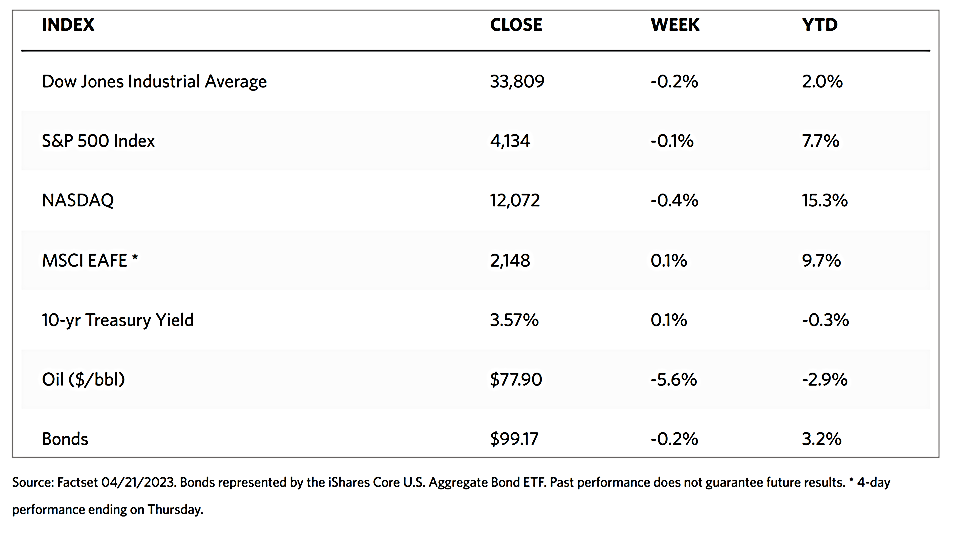
According to the WSJ weekly markets report, the Dow Jones Industrial Average (DJIA) dipped by 0.23% for the week although the transportation and utility averages and 65 composite inched upward. The total stock market index also slid by 0.05%. The broader S&P 500 Index is likewise down for the week by about 0.10% and the Nasdaq Stock Market Index, which tracks technology stocks, lost by 0.42%. The NYSE Composite Index corrected by 0.15%. Despite the correction in all the major stock indexes, the CBOE volatility index, a gauge of investors’ risk perception, came down by 1.76%, its lowest level since late 2021.
U.S. Economy
The economy continues to expand, however, there have been recent signals pointing to the inevitable cooling of the labor market and economic activity. The weekly jobless claims report released on Thursday showed signs that the labor market is growing weaker. Investors, however, appear uncertain as to whether this should be treated as good news or bad. If the labor market slows, the Federal Reserve may take this as a sign that inflation is coming under control and, therefore, further interest rate hikes may be dialed back. This would be good news. However, if the slowing labor market was taken as a sign of an impending contraction, the likely prognosis is that a recession is imminent. Then it would be bad news. Weekly claims increased slightly more than expected, but continued claims were elevated significantly more than anticipated and attained their highest level, 1.87 million, since November 2021.
Housing data also projected a weakening of activity, as starts and finishes slowed down from February’s data. Existing home sales descended, while year-over-year home prices lost ground by 0.9%, the largest decrease recorded going back 11 years. The picture painted by S&P Global was more optimistic in their Friday release. According to their analysis, private-sector employers increased hiring in early April at the fastest rate in nine months, while work backlogs grew even while businesses added capacity. The S&P Global U.S. Composite Purchasing Managers’ Index (PMI) of both services and manufacturing activity rose to its peak in almost a year. The PMI rose to 53.5, with readings over 50 indicating expansion. The strong PMI reading was attributed to stronger demand, improving supply chains, and strength in new orders. The manufacturing PMI was higher than expected and returned to expansion territory with a 50.4 reading for the first time since October.
The yield on the benchmark 10-year U.S. Treasury note surged following the S&P Global data release, reversing earlier declines and ending modestly higher for the week. It should be recalled that bond prices and yields move in opposite directions. The municipal bond market was weighed down somewhat by a spike in supply.
Metals and Mining
Markets have now come to accept the idea that the Federal Reserve will continue to raise interest rates, an issue that caused massive volatility in last month’s trading. At present, the markets have already firmly priced a 25-basis point hike for May, and have pushed back the timing of any potential rate cut to the end of the year. At the height of the banking crisis last month, a potential rate cut was speculated as early as June; as a result, gold prices are ending below $2,000 per ounce this past week due to profit-taking. Gold may see further lows in the short term, although the market remains on track to hit all-time highs within the year.
For the week, precious metals prices were mixed. Gold closed at $1,983.06 per troy ounce, coming down by 1.10% from the previous week’s close at $2,005.21. Silver dipped by 1.22% from its week-ago close at $25.39 to end this week at $25.08 per troy ounce. Platinum, on the other hand, rose by 7.54% from its close the previous week at $1,048.13, to end this week at $1,127.20 per troy ounce. Palladium likewise gained by 6.62% over its week-ago close at $1,505.38 to end this week at $1,605.10 per troy ounce. The three-month LME prices of base metals were likewise mixed. Copper came from its previous week’s close at $9,058.50 to this past week’s close at $8,794.50 per metric tonne, a decline of 2.91%. Zinc lost by 4.16% from its week-ago close at $2,837.00 to this week’s close at 2,719.00 per metric tonne. Aluminum inched upward by 1.25% from the previous week’s close at $2,367.00 to this week’s close at $2,396.50 per metric tonne. Tin climbed by 8.80% from the previous week’s close at $24,442.00 to this week’s close at $26,594.00 per metric tonne.
Energy and Oil
The labor market appears to be cooling, as indicated by an increase in the number of Americans filing for unemployment benefits. This seemed to lull expectations of another interest rate hike from the Federal Reserve which added to the bearish sentiment in the oil markets. A slowing economy signals weaker demand offsetting the falling inventories and adding to fears of dropping oil prices. Macroeconomic-related drivers are expected to dominate in the next two weeks as investors anticipate the Fed and ECB meetings in early May. In the meantime, the Biden administration attempts to allay concerns raised by lawmakers that last year’s 180-million-barrel drawdown of strategic petroleum reserves (SPR) may have damaged the SPR salt caverns.
Natural Gas
For the report week beginning Wednesday, April 12, and ending Wednesday, April 19, 2023, the Henry Hub spot price fell by $0.01 from $2.21 per million British thermal units (MMBtu) at the start of the week to $2.20/MMBtu at the week’s end. The price of the May 2023 NYMEX contract increased by $0.129 from $2.093/MMBtu to $2.222/MMBtu through the report week. The price of the 12-month strip averaging May 2023 through April 2024 futures contracts climbed by $0.108 to $3.006/MMBtu. International natural gas futures prices decreased during this report week. The weekly average front-month futures prices for liquefied natural gas (LNG) cargoes in East Asia fell by $0.05 to a weekly average of $12.56/MMBtu. Natural gas futures for delivery at the Title Transfer Facility (TTF) in the Netherlands, the most liquid natural gas market in Europe, fell by $0.48 to a weekly average of $13.35/MMBtu. In the corresponding week last year (the week from April 13 to April 20, 2022), the prices were $27.16/MMBtu and $30.06/MMBtu at East Asia and TTF, respectively.
World Markets
European shares moved sideways for the week on directionless trading in the absence of significant trading incentives. The pan-European STOXX Europe 600 Index gained a modest 0.45% as optimism about the economic outlook gradually picked up versus concerns about interest rates staying higher for a longer period. Major stock indexes were mixed. Germany’s DAX inched up by 0.47% while France’s CAC Index added 0.76%. On the other hand, Italy’s FTSE MIB fell by 0.45%. The UK’s FTSE 100 Index managed to gain by 0.54%. European government bond yields moved higher as investors assessed the chances that the European Central Bank (ECB) will again hike interest rates in May. Eurozone business activity seemed to pick up in April as indicated by a popular Purchasing Managers’ Index (PMI). The Hamburg Commercial Bank (HCOB) Flash Eurozone Composite PMI Output Index, which gauges activity in both the services and manufacturing sectors, rose to 54.4 seasonally adjusted from 53,7 in March, driven by a revival of demand in the services sector. Activity in the manufacturing sector, however, shrank, with the index falling to 48.5 from 50.4, which was likely influenced by protests in France that temporarily slowed output.
Japan’s stock market rose over the past week, with the Nikkei 225 Index coaxed up by 0.25% and the broader TOPIX Index rising by 0.81%. Core consumer price inflation remained above the March 2% target of the Bank of Japan (BoJ). This adds pressure on the BoJ to take steps to normalize monetary policy under its new Governor Kazuo Ueda. The governor reiterated the BoJ’s commitment to its easing stance until price stability is achieved, a message released by Ueda ahead of his first monetary policy meeting at the helm on April 27-28. In this light, the yield on the 10-year Japanese government bond remained unchanged at 0.46%. The yen was also little changed against the dollar, ending the week at JPY 134.
The Chinese stock market fell for the week, as investors’ sentiments were weighed down by mixed economic data and news that the U.S. may introduce fresh investment limits against China. The Shanghai Stock Exchange Index lost by 1.11% while the blue-chip CSI 300 declined by 1.45% in local currency terms. Hong Kong’s benchmark Hang Seng Index gave up 1.78%. China’s year-on-year gross domestic product (GDP) expanded by 4.5%, which was better than expected, in the first quarter of 2023, compared with last year’s growth rate of 3.0%. The recovery was driven by robust export growth and infrastructure investments, as well as a rebound in retail spending and property prices. Based on this growth reading, several banks were prompted to raise their annual growth forecasts for China as consumption continues to recover.
The Week Ahead
Home sales data and inflation measures are among the important economic data coming out in the week ahead.
Key Topics to Watch
- S&P Case-Shiller home price index (20 cities)
- FHFA home price index
- New home sales
- Consumer confidence
- Durable goods orders
- Durable goods minus transportation
- Advanced U.S. trade balance in goods
- Advanced retail inventories
- Advanced wholesale inventories
- Gross Domestic Product (GDP)
- Initial jobless claims
- Continuing jobless claims
- Pending home sales
- Employment cost index
- Personal income (nominal)
- Personal spending (nominal)
- PCE index
- Core PCE Index
- PCE (year-over-year)
- Core PCE (year-over-year)
- Chicago Business Barometer
- Consumer sentiment (final)
Markets Index Wrap Up