
Stock Markets
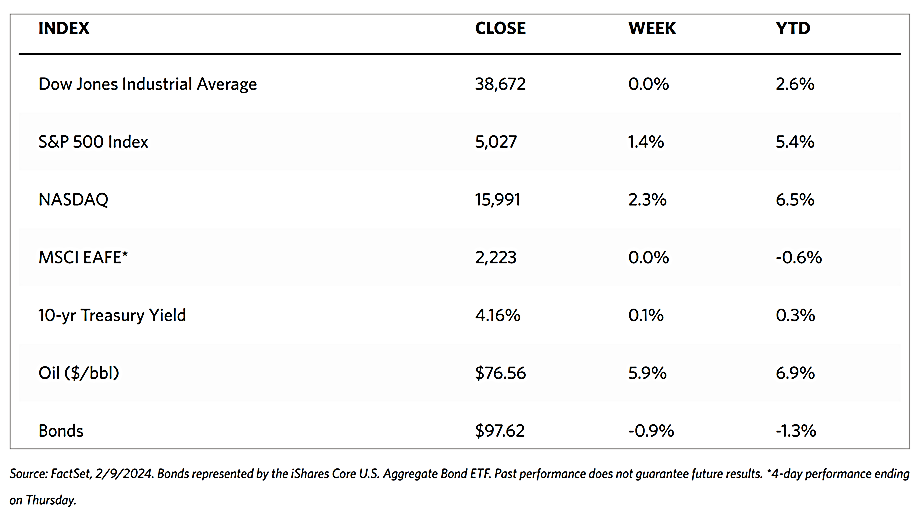
Markets continued to trek upward this week into record-breaking territory although the advance was narrow. The Dow Jones Industrial Average (DJIA) gained 0.04% week-on-week while the DJ Total Stock Market Index climbed by 1.51%. The technology-heavy Nasdaq Stock Market Composite gained 2.31% while the NYSE Composite rose by 1.02%. CBOE Volatility Index, the risk perception indicator, fell by 6.64% for the week. The big news, however, surrounded the meteoric rise of the S&P 500 Index which gained 1.35% but, in doing so, broke and held above the 5,000 long-term resistance level for the first time. The index traded at a high of 5.030.06 and a low of 5,000.34 for the week, closing on Friday at 5,026.61.
The continued market gains were heartening although the narrow climb may be a sign that this rally will not last. The equally weighted version of the S&P 500 Index significantly lags behind the standard market-weighted version for the fourth time in five weeks, suggesting that not all the counters are seeing new gains. There is also a downward trend in the number of stocks remaining above their 50-day moving averages. This is not necessarily an omen of bad fortune ahead, as the lack of buying interest may simply be the result of the lack of fresh economic data that would move the markets, so investors are focusing on individual companies’ earnings reports for buying motivation. Nevertheless, it would not be out of the ordinary if, after breaking into new highs, the market may come down to consolidate before it rallies again.
U.S. Economy
The economic surprises this week came from S&P Global’s assessment of the services sector activity. The services sector remains in remarkably good shape, jumping unexpectedly to a four-month high back into expansion territory, from December’s 50.5 to a solid 53.4 in January (readings above 50 signal expansion, below 50 indicate contraction). The counterpart metric of the Institute of Supply Management likewise indicated solid growth at 55.8, however, its measure of prices paid for services climbed to its highest level in almost a year. This reading sharply contrasted with recent data on prices paid by manufacturers, which have signaled falling prices for many inputs. The Labor Department on Friday lowered its initial estimate of December consumer inflation, from 0.3% to 0.2%.
In the assessment of many analysts, a hard recession appears to be increasingly unlikely as the Fed gradually shifts policies from hawkish to dovish, The worst-case scenario for the economy is dimming, but that does not completely discount the chances of even a mild recession or soft landing. A lower percentage of banks reported a tightening of credit conditions in the latest Senior Loan Officer Opinion Survey (SLOOS) released last week, which may suggest that a possible bottoming out in the credit cycle is imminent or has been passed. Although consumer spending will likely slow down, other economic sectors may be gaining momentum to provide an offset in the last semester of this year.
Metals and Mining
This week, gold prices continued to consolidate in a tight band between $2,000 and $2,050 per ounce. Nevertheless, consultants have confirmed that there remains pent-up demand for the precious metal, thus keeping the market for gold robust even if prices do not appear to have any strong bullish momentum. The volume of sales continues to be impressive in the present price environment, even if volumes do not meet the levels they were at last year. Analysts further note that Asian investors are buying precious metals, not only because of the Lunar New Year but to preserve their wealth in light of the uncertainty in the equity markets which may turn volatile.
This week, precious metals were mostly down. Gold lost by 0.76% from last week’s closing price of $2,039.76 to close this week at $2,024.26 per troy ounce. Silver fell by 0.35% from last week’s closing price of $22.69 to end this week at $22.61 per troy ounce. Platinum lost by 2.22% from its closing price one week ago at $896.95 to its closing price this week of $877.04 per troy ounce. Palladium ended this week at $861.86 per troy ounce, 9.17% lower than last week’s closing price of $948.92. The three-month LME prices of base metals went mostly in the same direction, Copper closed this week at $8,193.50 per metric ton, 3.40% lower than last week’s close of $8,482.00. Zinc ended the week at $2,327.50 per metric ton, down by 5.04% from its last traded price the week before at $2,451.00. Aluminum finished this week at $2,221.50 per metric ton, lower by 0.54% from last week’s close of $2,233.50. Tin bucked the trend when it closed at $25,895.00 per metric ton this week, gaining 1.35% from last week’s closing price of $25,550.00.
Energy and Oil
This week, the geopolitical risk premium rose significantly after Israel turned down a ceasefire offer in Gaza and bombed the border city of Rafah. This development makes it increasingly improbable that any de-escalation of tensions in Gaza may materialize in the upcoming weeks. Oil prices have been further buoyed by relatively bearish calls from the U.S. Energy Information Administration pronouncing that U.S. crude output is unlikely to exceed the current level of 13.3 million barrels per day (b/d) until early 2025. Brent is poised to end the week slightly below $82 per barrel.
Natural Gas
For the report week beginning Wednesday, January 31, and ending Wednesday, February 7, 2024, the Henry Hub spot price fell by $0.26 from $2.23 per million British thermal units (MMBtu) to $1.97/MMBtu, the lowest price since June 12, 2023. Regarding the Henry Hub futures price, the price of the March 2024 NYMEX contract decreased by $0.133, from $2.100/MMBtu at the start of the report week to $1.967/MMBtu at the week’s end. This is the lowest settlement price for the March 2024 contract since trading of this contract began 12 years ago. The price of the 12-month strip, averaging March 2024 through February 2025 futures contracts, declined by $0.125 to $2.641/MMBtu.
International natural gas futures price changes were mixed this report week. The weekly average front-month futures prices for liquefied natural gas (LNG) cargoes in East Asia rose by $0.04 to a weekly average of $9.46/MMBtu. Natural gas futures for delivery at the Title Transfer Facility (TTF) in the Netherlands, the most liquid natural gas market in Europe, fell by $0.06 to a weekly average of $9.07/MMBtu. The week last year corresponding to this report week (the week from February 1 to February 8, 2023), the prices were $18.30/MMBtu in East Asia and $17.83/MMBtu at the TTF. The last time early February prices at the TTF averaged below $10/MMBtu was in 2021.
World Market
The pan-European STOXX Europe 600 Index closed with a 0.19% gain on the back of the strong earnings reports of some companies. Gains were curbed, however, by the persistent concern that interest rates may stay higher for longer. Germany’s DAX hardly changed although it remained close to its record high. France’s CAC 40 Index gained by 0.73% while Italy’s FTSE MIB outperformed with a gain of 1,43%. The UK’s FTSE 100 Index lost by 0.56%. Prominent officials of the European Central Bank (ECB) continued to issue warnings against prematurely cutting interest rates. There continue to remain conditions that threaten efforts at inflation control such as sticky services prices, a resilient labor market, and attacks on vessels in the Red Sea that tend to disrupt supply chains. Policymakers want more evidence to support confidence that inflation will eventually settle at the ECB’s target 2% inflation rate.
Over the week, Japan’s stock markets rallied, with the Nikkei 225 Index advancing by 2% and the broader TOPIX rising by 0.7%. The Nikkei reached a 34-year high due to currency weakness that prompted some profit-taking. Gains were also limited as a result of a pullback in expectations that the U.S. Federal Reserve would cut interest rates as early as March. Supportive of investor sentiment, however, were reports of strong foreign investor interest in Japanese stocks in January prompted by a solid earnings reports season. Also driving investor confidence was the recent signal of the Bank of Japan (BoJ) monetary policy continuity even after it exited from its negative interest rate regime. The yield on the 10-year Japanese government bond rose to 0.72% from 0.68% at the end of the previous week as BoJ provided assurances that financial conditions would remain accommodative. These dovish remarks caused the yen to weaken from JPY 148 last week to JPY 149 against the U.S. dollar this week.
During a holiday-shortened week, Chinese stocks rallied in response to the government’s latest series of stimulus measures released to allay concerns about deepening deflation. The Shanghai Composite Index gained by 4.97% and the blue-chip CSI 300 advanced by 5.83% for the four-day trading week. Markets in mainland China remained closed for the Lunar New Year holiday on Friday, February 9, and will continue to remain closed for the next week. Trading at the exchanges will resume on Monday, February 19. The Hong Kong benchmark Hang Seng Index rose by 1.37% for the week. China’s consumer price index fell by 0.8% in January from the prior year period. This is an acceleration from the CPI’s 0.3% drop in December and marks its fastest decline since 2009. Leaning the contraction are food prices, particularly that of pork. Core inflation (which excludes volatile components food and energy costs) rose by 0.4%, its weakest rise since June 2023. The producer price index slipped by 2.5% year-on-year, marking the 16th consecutive month of deflation for factory gate costs.
The Week Ahead
Among the important economic data scheduled to be released this week are the January housing starts and building permits, the CPI inflation data, and retail sales data.
Key Topics to Watch
- Monthly U.S. Federal Budget for January
- Consumer price index for January
- Core CPI for January
- CPI year-over-year
- Core CPI year-over-year
- Initial jobless claims for February 3
- Empire State manufacturing survey for February
- Philadelphia Fed manufacturing survey for February
- Import price index for January
- Import price index minus fuel for January
- U.S. retail sales for January
- Retail sales minus autos for January
- Industrial production for January
- Capacity utilization for January
- Home builder confidence index for February
- Housing starts for January
- Building permits for January
- Producer price index for January
- Core PPI for January
- PPI year-over-year
- Core PPI year-over-year
- Consumer sentiment (prelim) for February
Markets Index Wrap-Up