
Stock Markets
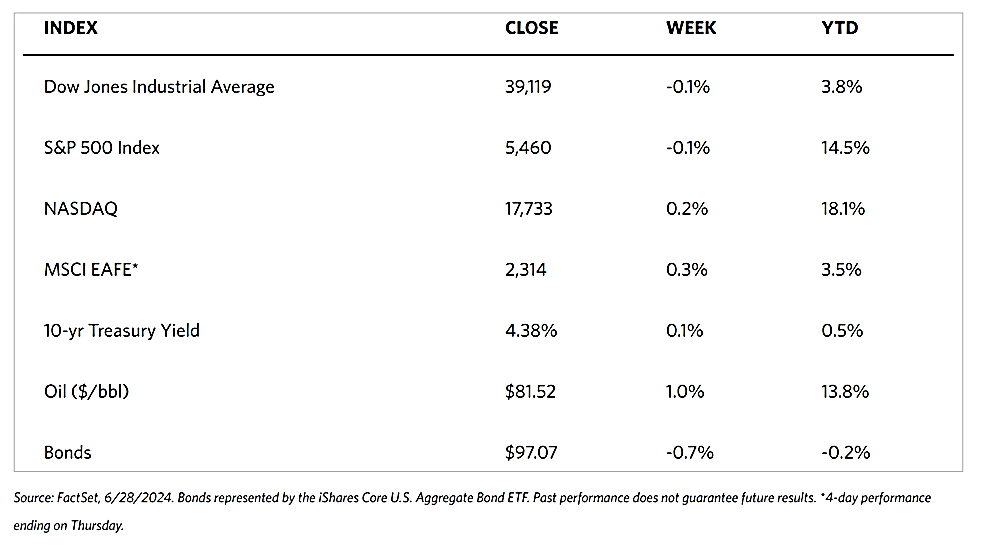
In the week just ended, small-cap stocks and technology stocks outperformed in mostly quiet trading. According to the Wall Street Journal Markets report, the Dow Jones Industrial Average (DJIA), comprised of 30 stocks, lost 0.08% over the week. The Dow Jones U.S. Total Stock Market Index hardly changed with a small gain of 0.04%. The broad S&P 500 Index surprisingly mirrored the narrow DJIA, losing 0.08%, while the technology-tracking index, the Nasdaq Stock Market Composite, inched up by 0.24%. The NYSE Composite gained marginally by 0.17%. The CBOE Volatility Index (VIX), the indicator of investor risk perception, dipped by 5.76%.
Growth stocks outpaced value stocks as small-cap companies and information technology stocks performed best. Index provider FTSE Russell was due to rebalance its series of Russell indexes after the markets closed on Friday, The primary indexes in the Russell family include Russell 3000, 2500, 2000, 1000, Top 200, Top 50, and a host of other Indexes. So it is likely that some of the market activity during the week may have stemmed from positioning adjustments by investors tracking those indexes.
U.S. Economy
This week, news about the banking sector was featured in the headlines and drove a common benchmark for the industry, the KBW Bank Index, to a strong performance. Media reports announced that the Federal Reserve is considering significantly lighter additional capital requirements for banks than had originally been proposed by regulators in the wake of the banking crisis in March 2023. This positive news was followed by the Fed’s declaration that all 31 of the large U.S. banks assessed by the central bank in its latest round of stress testing remain above their minimum capital levels. This potentially allows the assessed banks to return capital to their shareholders in the form of dividends and buybacks.
The Bureau of Economic Analysis released on Friday morning the May data for the core personal consumption expenditures (PCE) price index. The core PCE index excludes food and energy prices and is the Fed’s preferred measure of inflation. This indicator rose by 0.1% from April. Markets welcomed the deceleration from April’s upwardly revised 0.3% rate as it may signal that the Fed rate cut may likely occur in September.
Metals and Mining
Gold continues to trade in the range between $2,300 to 2,350 for now, but the longer it stays within this narrow margin, the better consolidated this metal would be at this support level. Friday marked the close of the second quarter of 2024, and this is the third consecutive quarter that gold has established a new all-time quarterly closing price. Its close this week is higher than the end of the first quarter by more than 5%. On an annual basis, gold prices are up by a remarkable 21% from the end of the second quarter of last year. Gold’s long-term chart justifies the current extreme bullishness of many commodity analysts, and it is difficult to see a scenario where the current uptrend materially shifts. The price also has solid fundamental macroeconomic support that aligns with the clear technical uptrend.
The spot price of precious metals ended the week mixed. Gold ended at $2,326.75 per troy ounce, 0.21% higher than its close last week at $2,321.98. Silver, which ended last week at $29.55, closed this week at $29.14 per troy ounce for a decline of 1.39%. Platinum gained 0.14% from its closing price last week at $994.90 to end this week at $996.26 per troy ounce. Palladium ended the week at $977.10 per troy ounce, 2.33% higher than last week’s closing price of $54.81. The three-month LME prices of the base metals did not fare any better. Copper, which ended at $9,682.50 last week, closed at $9,515.50 per metric ton for a loss of 1.72%. Aluminum descended by 0.84% from last week’s closing price of $2,513.50 to end this week at $2,492.50 per metric ton. Zinc, which ended last week at $2,844.00, closed this week higher by 3.01% to close at $2,929.50 per metric ton. Tin last traded at $32,208.00 per metric ton this week, ending 1.42% lower from its last weekly close at $32,671.00.
Energy and Oil
Attention of investors and analysts are currently fixated on the U.S. inflation data even as crude oil prices maintained their hot streak, ending this week with its third consecutive weekly gain. Slackening economic data from the U.S. in May were overshadowed by surging geopolitical tensions centered on Israel and Lebanon. Every day this week saw prices posting a small but steady rise. Brent is set to finish the week at $87 per barrel. Meanwhile, hedge funds and other money managers have expanded their exposure to Brent futures and options. In the week ending June 18, they have bought the equivalent of 69 million barrels, making this the fourth fastest week-on-week increase since 2013.
Natural Gas
For the report week beginning Wednesday, June 19, and ending Wednesday, June 26, 2024, the Henry Hub spot price rose by $0.06 from $2.39 per million British thermal units (MMBtu) to $2.45/MMBtu. Regarding Henry Hub futures, the July 2024 NYMEX contract expired at the end of the report week at $2.628/MMBtu, down by $0.113 for the week. The August 2024 NYMEX contract price decreased by $2.745/MMBtu, down by $0.109 from the beginning to the end of the week. The price of the 12-month strip averaging August 2024 through July 2025 futures contracts declined by $0.085 to $3.268/MMBtu.
Natural gas futures price changes in the international market were mixed for the report week. The weekly average front-month futures prices for liquefied natural gas (LNG) cargoes in East Asia increased by $0.25 to a weekly average of $12.61/MMBtu. Natural gas futures for delivery at the Title Transfer Facility (TTF) in the Netherlands, the most liquid natural gas market in Europe, decreased by $0.27 to a weekly average of $10.75/MMBtu. In the week last year corresponding to this report week (from June 21 to June 28, 2023), the prices were $11.96/MMBtu in East Asia and $10.72/MMBtu at the TTF.
World Markets
The European stock market was lackluster this week. The pan-European STOXX Europe 600 Index ended lower by 0.72% due to heightened political uncertainty in France ahead of the snap election called by President Emmanuel Macron. The major regional stock indexes were mixed. France’s CAC 40 Index lost by 1.96%, Italy’s FTSE MIB slipped by 0.46%, and Germany’s DAX climbed by 0.40%. The UK’s FTSE 100 Index slid by 0.89%. Inflation in June slowed in France and Spain as the prices of fuel and food continued to increase, albeit at a slower rate. In Spain, inflation dropped to 3.5% from just over a one-year high of 3.8%. The annual rate in France fell to 2.5% in June from 2.6%. The German economy has exhibited difficulty in overcoming stagnation, as highlighted by a rise in unemployment and an unexpected deterioration in business confidence. The jobless rate hit its highest level in just over three years at 6.0% in June from 5.9% in May. The Ifo Institute’s think tank’s business confidence indicator softened from 89.3 in May to 88.6 in June, attributable to worsening expectations in marketing and trade.
In Japan, stocks rose over the week. The Nikkei 225 Index gained 2.6% while the broader TOPIX Index added 3.1%, mainly due to the historic weakness in the yen continuing to support Japan’s export-heavy industries. The yen fell to around JPY 160.6 against the USD from its week-ago exchange rate of JPY 159.7 to USD 1, which is close to its lowest level in 38 years. Contrary to expectations that authorities would intervene to support the yen and halt its sharp decline, only verbal reassurance was issued from Finance Minister Shunichi Suzuki. On the economic front, attention was focused on the Tokyo-area core consumer price index reading for June. Inflation was seen to rise by 2.1% year-on-year which is higher than consensus estimates and an acceleration from the May inflation rate of 1.9%. The increase was attributed mainly to services inflation and the growing speculation about Bank of Japan (BoJ) policy normalization. The BoJ aims to achieve its 2.0% inflation target sustainably. Both retail sales and industrial production grew in May at a faster rate than was anticipated.
A light economic calendar and concerns that the economy was slowing curbed investors’ risk appetite and brought Chinese stocks down for the week. The Shanghai Composite Index and the blue-chip CSI 300 Index both declined slightly over the week. The Hong Kong benchmark Hang Seng Index declined by 1.5%. In May, industrial profits at large companies ascended by 0.7% from a year earlier, but it is down from April’s 4% gain according to the National Bureau of Statistics. The year-on-year earnings improvement was attributed by analysts to higher commodity prices, which boosted profits for mining companies. The month-on-month decline, however, reflected sluggish consumption amid the country’s prolonged property downturn and persistent deflationary pressure. In the future, investors will be keen to watch out for China’s official purchasing managers’ index (scheduled for release on Sunday), followed by the private sector Caixin factory survey on July 1. Also contributing to the week’s declines is foreign selling, with global funds unloading about RMB 49.4 billion of onshore shares via trading links with Hong Kong in June through last Wednesday.
The Week Ahead
The ISM manufacturing PMI, jobless claims, and the nonfarm payrolls report for June are among the important economic releases scheduled in the coming week.
Key Topics to Watch
- S&P final U.S. manufacturing PMI for June
- Construction spending for May
- ISM manufacturing for June
- Federal Reserve Chair Jerome Powell speech in Portugal (July 2)
- Job openings for May
- Auto sales for June
- New York Fed President John Williams speech in Portugal (July 3)
- ADP employment for June
- Initial jobless claims for June 29
- U.S. trade deficit for May
- S&P final U.S. services PMI for June
- Factory orders for May
- ISM services for June
- Minutes of Fed’s June FOMC meeting
- New York Fed President John Williams speech in India (July 5)
- U.S. employment report for June
- U.S. unemployment rate for June
- U.S. hourly wages for June
- Hourly wages year over year
Markets Index Wrap-Up