
Stock Markets
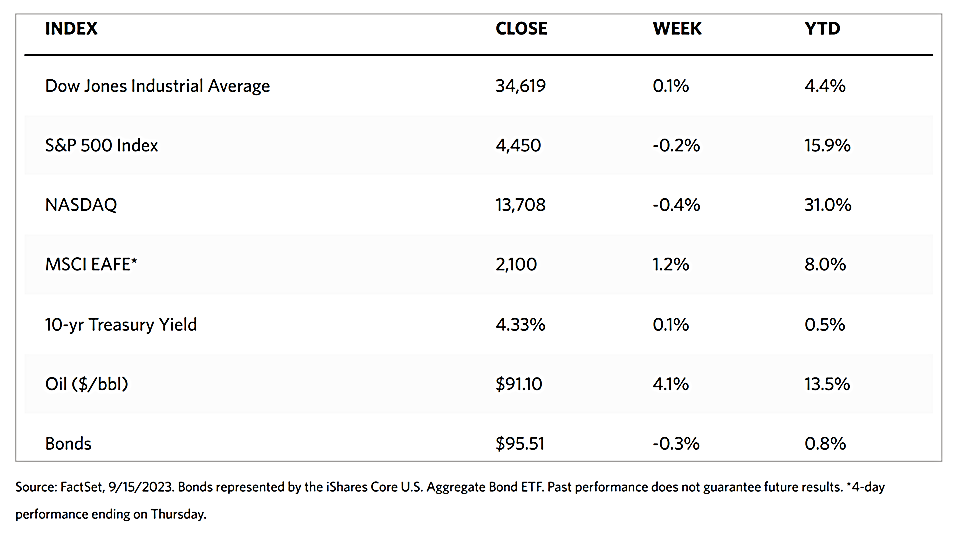
Stock indexes ended up mixed this week as investors waited on the sidelines for confirmation of a clearer trend. The Dow Jones Industrial Average (DJIA) ended slightly up by 0.12% although the DJ Total Stock Market lost 0.21%. The broad-based S&P 500 Index inched down by 0.16% and the technology-tracking Nasdaq Stock Market Composite dipped even lower, losing 0.39% of its value. The NYSE Composite, like the DJIA, added 0.60% at the week’s close. The CBOE Volatility Index, the market’s risk perception indicator, descended by 0.36%. Value stocks led the gains while large-cap shares outperformed small caps. The investors’ rush to value is a reaction to the U.S. benchmark West Texas Intermediate oil prices surging above $90 per barrel for the first time since November 2022.
Meanwhile, Apple’s new product introduction event on Tuesday included a price increase on its top-of-the-line iPhone 15, causing technology and growth stocks to pull back. Sentiment towards the technology sector was further dampened through the week after Apple’s products received mixed reviews. The broad market was boosted, however, by the initial public offering of 2023 triggering a first-day price jump as shares of a UK microchip designer started trading on the Nasdaq on Tuesday. Positive economic data released on Wednesday further sent optimistic waves across the markets.
U.S. Economy
On Wednesday, the eagerly anticipated August consumer price index (CPI) data was released. It showed that the Federal Reserve has achieved some progress in its attempt to control inflation. Unfortunately, the recent resumption of increases in energy prices may result in further tightening monetary policy by the central bank. The widely expected effect of higher gasoline prices materialized as headline CPI number showed the largest monthly increase since August 2022. Nevertheless, the markets took in stride the news that the core CPI increase, which excluded food and energy, was marginally higher than expected. On Thursday, the August producer price index (PPI) data similarly indicated that the headline producer prices rose more than expected while the core PPI fell in line with expectations.
In the meantime, the retail sales for August were strong which further demonstrated that consumers remain willing to spend. Overall, the week’s economic data hardly impacted the market’s expectations that the Fed will hold rates steady at its policy meeting scheduled for September 19-20. Much of the economic data seems to affirm the growing expectation for a soft-landing scenario that inflation will gradually cool and the Fed’s target rate will be achieved without a deep recession. Affirming this outlook, Wall Street’s widely-followed “fear gauge,” the Chicago Board Options Exchange (CBOE) Volatility Index, or VIX, descended to its lowest level since before the onset of the pandemic in early 2020. U.S. Treasury yields, on the other hand, experienced a modest increase over most maturities as prices were little changed in the secondary markets, with investor attention being focused on the primary market.
Metals and Mining
The gold market appears to have broken out of the $1,800 support only to be stuck in directionless range trading between $1,900 and $1,980 per ounce. Trading in this market may be difficult as well as unexciting, but there is a silver lining. Prices have so far not broken down below the $1,900 level, which is building fresh support at this price. Despite the Fed’s hawkish position on monetary policy, the bond yields holding above 4% and the U.S. dollar index near a six-month high above 105 points, the gold market appears unaffected and remains resilient above the August lows. One of the reasons for gold’s ability to withstand the assault of higher yields and the U.S. dollar is that central banks continue to buy substantial quantities of gold. Data from the World Gold Council, the central banks of Poland, Czechia, and India extended their months-long buying spree in August. The National Bank of Poland dovetails Singapore and China as the third-largest gold buyer this year. The central banks constitute a significant demand factor in the gold market, making it difficult to be bearish on this precious metal.
The spot market for precious metals moved up this week. Gold climbed by 0.25% from last week’s close at $1,919.08 to end this week at $1,923.91 per troy ounce. Silver ascended by 0.48% from the previous week’s closing price of $22.93 to this week’s closing price of $23.04 per troy ounce. Platinum, which closed last week at $896.60, ended this week at $929.69 per troy ounce to gain by 3.69%. Palladium came from its price last week at $1,199.23 to end this week at $1,250.89 per troy ounce for an upward leap of 4.31%. The three-month LME prices of industrial metals also moved up collectively. Copper, which closed last week at $8,242.50, ended this week at $8,417.50 per metric ton for a gain of 2.12%. Zinc was worth $2,443.50 last week and this week was worth $2,570.00 per metric ton, thus gaining 5.18% for the week. Aluminum closed last week at $2,183.50 and this week at $2,224.50 per metric ton, rising by 1.88%. Tin closed the previous week at $25,573.00, while its closing price this week was $25,895.00 per metric ton for a gain of 1.26%.
Energy and Oil
A string of positive macroeconomic reports on China suggesting that both manufacturing output and retail sales grew by 4.5-4.6% year-on-year triggered a bull run in oil prices that continued throughout this week. The new data surpassed analysts’ expectations and buoyed investor expectations in the oil market that a resumption of China’s economic recovery will enhance the demand for crude and other energy sources. Chinese refinery runs reached an all-time high in August at 15.23 million barrels per day (b/d), transforming the country from an underperforming bearish factor to the largest bullish upside for oil prices.
Demand optimism was lifted by the news from China despite both Europe and the United States struggling with refinery maintenance. Furthermore, OPEC reiterated its bullish outlook for 2024 oil demand, forecasting that it will rise by 2.24 million b/d on the back of a faster economic recovery in major economies. The outlook overrides the concerns regarding high-interest rates and elevated inflation, with global GDP growth forecasted to come in at 2.5% next year.
Natural Gas
The U.S. exported a record volume of natural gas in the first half of this year than in any other previous semi-annual period. It averaged 12.5 billion cubic feet per day (Bcf/d), exceeding the same period in 2022 by 11%. In May, U.S. natural gas exports as liquefied natural gas (LNG) and by pipeline averaged a monthly record high of 13.6 Bcf/d. Since 1957, the U.S. once more became a natural gas net exporter (i.e. natural gas exporters exceeded natural gas imports) for the first time in 2017, due primarily to increased LNG exports.
For the report week starting Wednesday, September 6, and ending Wednesday, September 13, the Henry Hub spot price rose by $0.27 from $2.49 per million British thermal units (MMBtu)to $2.76/MMBtu. The price of the October 2023 NYMEX contract increased by $0.17, from $2.510/MMBtu at the start of the report week to $2.680/MMBtu by the week’s end. The price of the 12-month strip averaging October 2023 through September 2024 futures contracts rose by $0.032 to $3.240/MMBtu.
International natural gas futures prices ascended this report week. the weekly average front-month futures prices for liquefied natural gas (LNG) cargoes in East Asia increased by $0.10 to a weekly average of $13.36/MMBtu. Natural gas futures for delivery at the Title Transfer Facility (TTF) in the Netherlands, the most liquid natural gas market in Europe, increased by $0.23 to a weekly average of $10.98/MMBtu. In the week last year corresponding to this week (i.e., from September 7 to September 14, 2022), the prices were $53.19/MMBtu in East Asia and $60.81/MMBtu at the TTF.
World Markets
European equities ended higher this week, with the pan-European STOXX Europe 600 Index gaining by 1.60%. Germany’s DAX gained by 0.94%, France’s CAC 40 Index climbed by 1.91%, and Italy’s FTSE MIB surged by 2.35%. The UK’s FTSE 100 Index jumped by 3.12%, helped by the depreciation of the UK pound versus the U.S. dollar. A decline in the pound translates to higher earnings for dollar-earning multinational companies listed on the exchange that generate overseas revenue. Investor sentiment also appeared to have been lifted by better economic data out of China indicating that it has resumed its path towards economic recovery, and Europe’s as well. While the European Central Bank (ECB) raised interest rates, it nevertheless signaled that borrowing costs may have reached a peak. The ECB raised interest rates for the 10th consecutive time. The ECB president proclaimed that a “solid majority” of policymakers backed the quarter-point rate hike that took the key deposit rate to a record high of 4.0%. The interest rate has reached a level that will return inflation to the target if maintained for a sufficiently long duration.
Japan’s stock markets rose during the week. The Nikkei 225 Index climbed by 2.8% while the broader TOPIX Index surged by 2.9%. Investor optimism was helped by good news about China’s macroeconomic situation, dispelling the uncertainty about the impact of the country’s stimulus efforts on its economic growth and markets. The strong U.S. bourses and the weakness in the yen also drove the stock markets, since a weak currency is perceived to be beneficial to Japan’s export industry. The Bank of Japan’s (BoJ’s) governor suggested that the central bank could have sufficient data by the end of the year to determine if wages will continue to rise and lead to the end of the policy of negative interest rates. Japan’s policy is anchored on the principle that sustained wage growth is key to the achievement of the country’s inflation target of 2%. While Gov. Kazuo Ueda was careful to stress that policy normalization is still some distance away, his comments were perceived as hawkish by investors. They were also taken to be a verbal intervention in response to the historic weakness in the yen.
Chinese stock markets ended mixed in reaction to official indicators that revealed that the country’s economy may have bottomed despite data also pointing to ongoing weakness in the property market. The Shanghai Composite Index moved sideways with neither gain nor loss for the week while the blue-chip CSI 300 Index slid down by 0.83%. The Hang Seng Index, Hong Kong’s benchmark, gave up 0.1%. The official data for August indicated that the country was well on its way towards economic stabilization. Indicators of industrial production and retail sales grew more than forecast last month from a year ago. Unemployment fell unexpectedly from July. On the other hand, fixed-asset investment growth fell short of forecasts because of a steeper decline in real estate investment. New bank loans rose higher than the consensus estimate, topping RMB 1.36 trillion in August. This was higher than July’s RMB 345.9 billion. Corporate demand largely drove credit expansion, while household and longer-term loans also grew.
The Week Ahead
Included in the important economic data expected to be released next week are the FOMC meeting, housing and home builder data, and preliminary S&P Global PMI data for September.
Key Topics to Watch
- Home builder confidence index
- Housing starts
- Building permits
- Fed interest rate decision
- Fed Chair Powell press conference
- Initial jobless claims
- Philadelphia Fed manufacturing survey
- U.S. current account deficit
- U.S. leading economic indicators
- Existing home sales
- Fed Gov. Lisa Cook speaks
- S&P flash U.S. services PMI
- S&P flash U.S. manufacturing PMI
- Minneapolis Fed President Neel Kashkari speaks
- San Francisco Fed President Mary Daly speaks
Markets Index Wrap Up