
Weekly Market Review – January 25, 2025
Stock Markets
The week began with the inauguration of the 47th U.S. President, Donald Trump. On his first day in office, Trump signed a record 26executive orders that, from a macroeconomic perspective, focused on four key areas, namely energy, immigration reform, tariffs, and technology. The new policy proposals were in general more measured and less severe than initially expected, which the market welcomed, although it does not dispel the likelihood of market volatility ahead as policy updates are released.
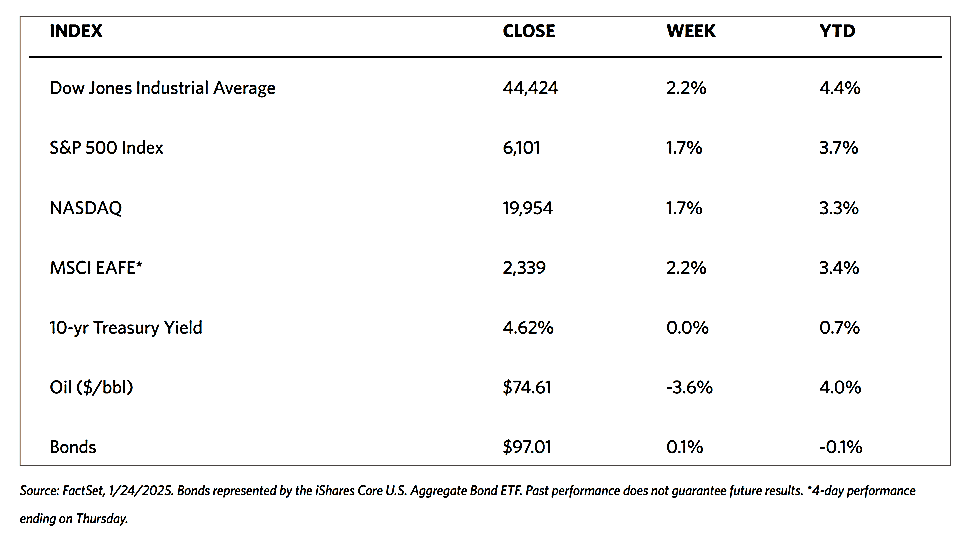
Major stock indexes were up for the week. The 30-stock Dow Jones Industrial Average (DJIA) advanced by 2.15% while the Total Stock Market Index added 1.72%. The broad S&P 500 Index gained by 1.74% and notched a new record high intraweek. The technology-heavy Nasdaq Stock Market Composite gained 1.65%, and the NYSE Composite also added 1.99%. For the first time this year, growth stocks outperformed value shares as measured by the Russell indexes. The CBOE Volatility Index, which measures investor risk perception, fell by 7.01%.
On Tuesday, President Trump announced a new joint venture between Softbank, Open AI, Oracle, and Stargate, which will inject $500 billion towards the development of an AI-supportive infrastructure. This spurred a rally among AI-related stocks in anticipation of a potential jump in spending. As the first 100 days of this new administration play out, strong fundamentals underlie the investing environment supported by a healthy consumer and positive economic and earnings growth. This should prevail and even improve as new policies are rolled out since most of the uncertainty is already resolved.
U.S. Economy
On Friday morning, S&P Global released its first estimate of January economic activity. The report states that growth in business activity slowed month-on-month in January but remained expansionary. For the first time in six months, the report indicated that business activity was supported by a return to growth in the manufacturing sector. Services activity continued to grow during the month, although the pace of growth was slower.
On Friday, the National Association of Realtors also reported existing home sales for the month of December. According to the report, sales rose by 2.2% during the month to a seasonally adjusted annual rate of 4.24 million, the highest reading in ten months. The report also noted, however, that despite the upside surprise at the year’s end, amid elevated mortgage rates and record-high home prices existing home sales for the full year dropped to the lowest level in almost 30 years.
In January, the University of Michigan’s Index of Consumer Sentiment declined for the first time in six months from, 74.0 in December to 71.1. The drop is largely attributed to rising inflation expectations and concerns regarding unemployment.
Metals and Mining
For gold investors, the inauguration of Donald Trump as the 47th President of the United States marked an auspicious start. Gold prices have closed the week near $2,800 per ounce, close to their record highs from late October. Global uncertainties and mounting concerns about inflation are the factors that have caused gold to thrive presently. Before Trump’s inauguration, several market experts and economists warned that his policies, particularly regarding tariffs, tend to push inflation higher and may compromise global economic growth. For now, gold’s outlook appears robust although some volatility may develop along the way. The uptrend of gold prices may be sustained although further volatility may be driven by geopolitical and economic uncertainty.
The spot market for precious metals gained ground this week. Gold closed last week at $2,703.25 and gained 2.49% to end this week at $2,770.58 per troy ounce. Silver ended last week at $30.37 and increased by 0.72% to settle this week at $30.59 per troy ounce. Platinum, with a closing price last week at $944.40, rose by 0.75% to close at $951.45 per troy ounce. Palladium, formerly at $951.50, ascended by 3.83% to settle this week at $987.93 per troy ounce. The three-month LME prices of industrial metals were mixed. Copper closed the week at $9,276.00 per metric ton, 0.94% higher than last week’s close at $9,190.00. Aluminum ended this week at $2,641.00 per metric ton, lower by 1.62% from the last weekly close of $2,684.50. Zinc closed this week at $2,827.50, lower by 3.89% from last week’s close at $2,942.00. Tin ended this week at $30,156.00 per metric ton for a gain of 1.28% over last week’s close at $29,775.00
Energy and Oil
The key theme throughout the week revolved around uncertainty regarding Trump’s tariff threats on Canada and Mexico. Oil markets continued to await February 1 to discern whether the talk about tariffs is part of a negotiation tactic or something more. As ICE Brent ticked lower to $79 per barrel, US President Donald Trump also called on OPEC to immediately increase oil production in order to lower oil prices, raising another contentious issue between the cartel and the White House. President Trump further announced that his administration would cease buying crude oil from Venezuela. If this pushes through it will potentially rescind the 2022 Chevron waiver that allowed the U.S. major to ramp up production to 200,000 barrels per day across the country.
Natural Gas
For the report week beginning Wednesday, January 15, and ending Wednesday, January 22, 2025, the Henry Hub spot price fell by $0.54 from $4.43 per million British thermal units (MMBtu) to $3.89/MMBtu. The Henry Hub reached an intraweek high on Friday, January 17 of $10.07/MMBtu, its highest price since January 2024. Regarding Henry Hub futures, the price of the February 2025 NYMEX contract decreased by $0.12, from $4.083/MMBtu at the start of the report week to $3.960/MMBtu at the week’s end. The price of the 12-month strip averaging February 2025 through January 2026 futures contracts rose by $0.04 to $4.011/MMBtu. Natural gas spot prices fell at most locations this report week. Price changes ranged from a decrease of $0.97 at PG&E Citygate to an increase of $11.04 at Transco Zone 6 NY.
International natural gas futures price changes were mixed this report week. The weekly average front-month futures prices for liquefied natural gas (LNG) cargoes in East Asia decreased by $0.14 to a weekly average of $14.01/MMBtu. Natural gas futures for delivery at the Title Transfer Facility (TTF) in the Netherlands, the most liquid natural gas market in Europe, increased by $0.57 to a weekly average of $14.57/MMBtu. In the week last year corresponding to this report week (beginning January 17 and ending January 24, 2024), the prices were $9.49/MMBtu in East Asia and $8.92/MMBtu at the TTF.
World Markets
European stocks climbed this week after U.S. President Trump did not announce new tariffs in his first week in office. The pan-European STOXX Europe 600 Index ended 1.23% higher in local currency terms. Also driving stocks higher is the growing expectation that the European Central Bank (ECB) could consider further cutting interest rates. Germany’s DAX rose by 2.35% and France’s CAC 40 Index ascended by 2.83%. Falling by 0.18%, however, was Italy’s FTSE MIB. The UK’s FTSE 100 Index was hardly changed. In the Eurozone, business activity increased slightly in January, according to purchasing managers’ surveys compiled by S&P Global. Demand, however, continued to be weak. The composite output index registered 50.2, up from 49.6 – an optimistic reading, since levels above 50 denote expansion. For the second consecutive month, activity in the services sector increased modestly. Manufacturing remains contractionary but companies expect that output will increase one year forward. In France, business activity also remains contractionary; in Germany, however, the condition has stabilized after six straight months of declines. In the rest of the European bloc, activity expanded modestly for the 13th consecutive month. In the UK, wage growth, excluding bonuses, climbed to a six-month high of 6.0% in the three months through November. This is in line with expectations. The unemployment rate, however, unexpectedly rose to 4.4% at the same time the payroll numbers experienced its sharpest drop since November 2020. There was also a further fall in job openings.
Japan’s stock markets gained over the week over the hopes that Japanese exporters would further be boosted by the decision of U.S. President Trump to refrain from imposing new tariffs on his first day in office. The Nikkei 225 Index rose by 3.85% and the broader TOPIX Index climbed by 2.67% for the week. A stronger currency has posed a modest headwind. The yen appreciated from the low JPY 156 range at the end of the previous week to the high end of the JPY 155 range versus the US dollar. Comments by Japan’s finance minister suggesting that the government may be prepared to take appropriate action to support the yen underpinned the gains of the yen. In a hawkish move, the Bank of Japan (BoJ) raised its policy rate for the third time in a year. The 0.25 percentage point increase brought the policy rate to about 0.5%. This is its highest level since the 2008 global financial crisis. From the prior week’s 1.20%, the yield on the 10-year Japanese government bond rose to 1.23%. Provided that the BoJ’s outlook for economic activity and prices is realized, the central bank will accordingly continue to raise the policy interest rate and adjust the degree of monetary accommodation. Further monetary policy normalization by the BoJ is supported by the latest consumer inflation data. Recent reports showed that price growth was well above the central bank’s 2% target. In December 2024, Japan’s core consumer price index rose by 3.0% year-on-year, up from November’s 2.7% year-on-year and matching expectations.
The Shanghai Composite Index added 0.33% this week while the blue-chip CSI 300 gained 0.54%. The Hong Kong benchmark Hang Seng Index added 2.46%. Chinese stocks rose amid news that President Trump may be taking a softer stance on China tariffs. Banks’ one- and five-year loan prime rates were left unchanged at 3.1% and 3.6%, respectively. In October, Chinese lenders cut the benchmark lending rates by 25 basis points, a higher-than-expected level, to revive the economy. Analysts foresee that the central bank will continue to ease monetary policy in 2025, and even potentially cut the reserve requirement ratio and interest rates. In the meantime, Beijing intensified efforts to ease market uncertainty caused by the new U.S. administration. On the economic front, China’s youth unemployment rate fell for the fourth straight month since reaching its recent highest level in August 2024. Excluding students, the December jobless rate for 16- to 24-year-olds declined to 15.7% from November’s 16.1%. In the prior week, data released showed the nationwide jobless rate edged up to 5.1% in December from 5% in November.
The Week Ahead
The FOMC meeting, durable goods orders for December, and the first preliminary estimate for the fourth quarter GDP are among the important economic releases scheduled for the coming week.
Key Topics to Watch
- New home sales for Dec.
- Durable-goods orders for Dec.
- Durable-goods minus transportation for Dec.
- S&P Case-Shiller home price index (20 cities) for Nov.
- Consumer confidence for Jan.
- Advanced U.S. trade balance in goods for Dec.
- Advanced retail inventories for Dec.
- Advanced wholesale inventories for Dec.
- FOMC interest-rate decision
- Fed Chair Powell press conference (Jan. 29)
- GDP for Q1
- Initial jobless claims for Jan. 25
- Pending home sales for Dec.
- Fed Gov. Michelle Bowman speaks (Jan. 31)
- Employment cost index for Q4
- Personal income (nominal) for Dec.
- Personal spending (nominal) for Dec.
- PCE index for Dec.
- PCE (year-over-year)
- Core PCE index for Dec.
- Core PCE (year-over-year)
- Chicago Business Barometer (PMI) for Jan.
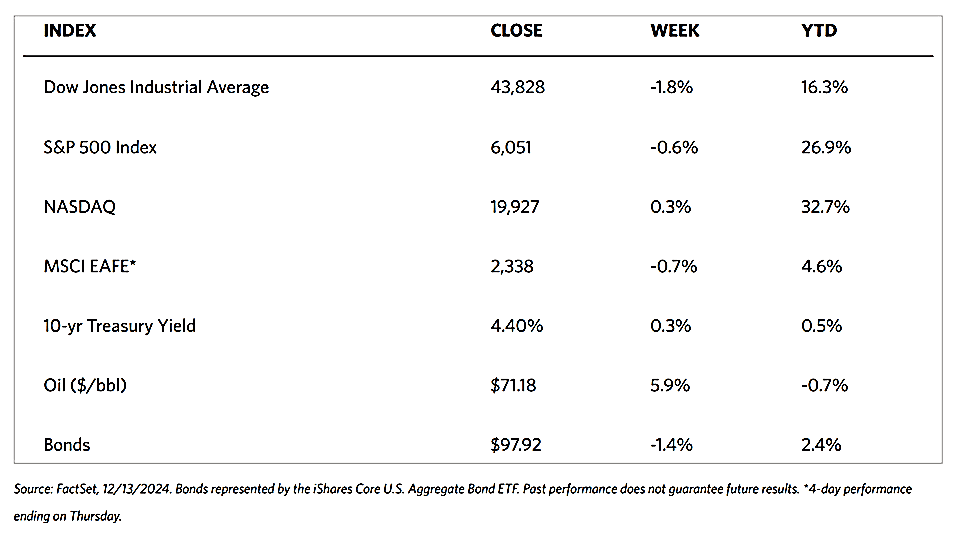
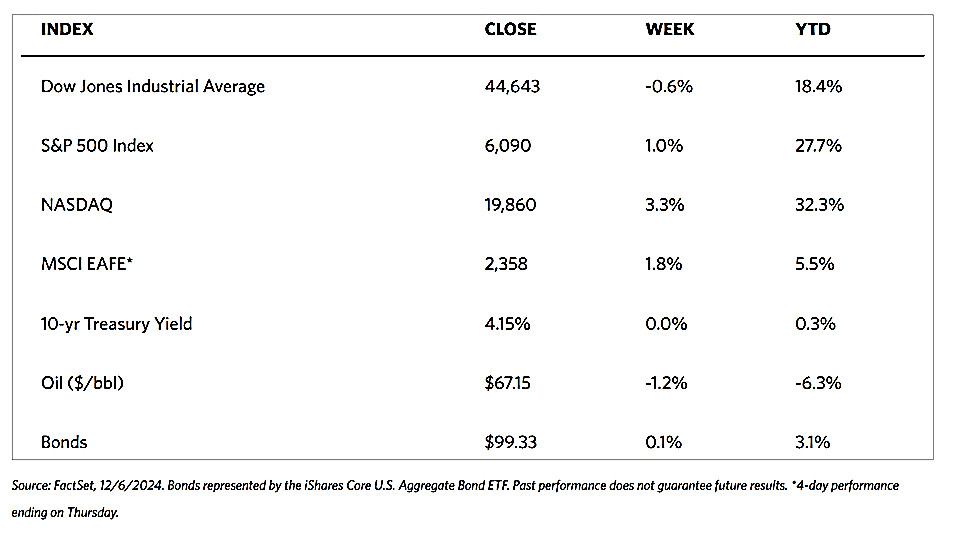
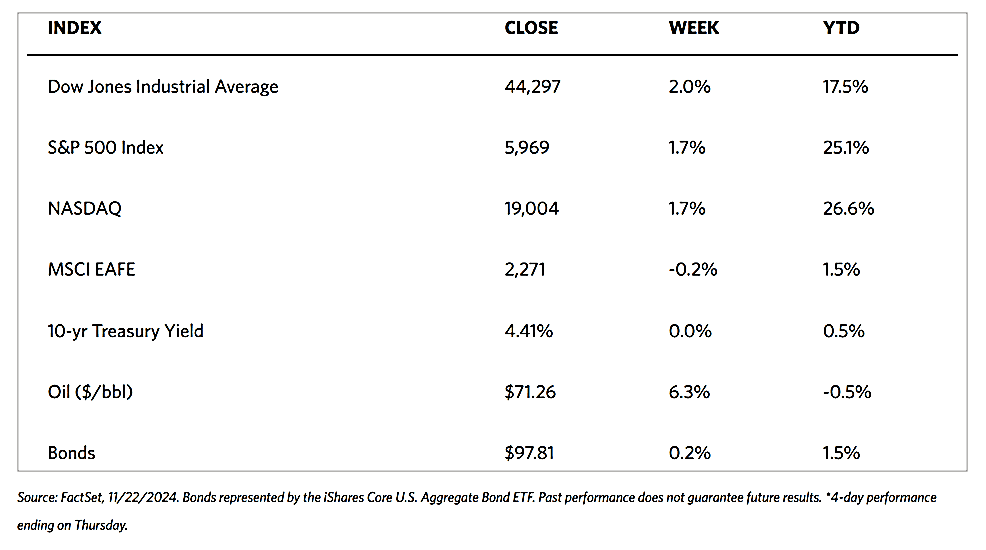
Markets Index Wrap-Up