Gold-coated microneedles can detect subtleties in how liver and kidneys process drugs in real time
Scientists have taken a giant leap forward with the development of tiny microneedles designed to detect subtle but critical changes in how the liver and kidneys process therapeutic drugs. The experimental technology, under development at the University of California, Los Angeles, aims to overcome longstanding limitations that have hindered wearable microneedle biosensors.
“Wearable microneedle biosensors promise real-time molecular monitoring for precision medicine but are limited by low sensitivity and tissue abrasion,” writes Dr. Jialun Zhu, lead author of a new study published in Science Translational Medicine.
“Overcoming these challenges, we recast electrode functionality not merely as a sensing substrate but as a mechanism for resilient, high signal-to-noise ratio measurements in tissue,” added Zhu, a bioengineer in UCLA’s Samueli School of Engineering.
In plainer English, the multidisciplinary UCLA team was able to get their system to work flawlessly compared with similar devices by other research groups.
Tracking drug clearance in real time
The team has developed a biosensor that in early research already shows promise for real-time in-tissue monitoring of drug pharmacokinetics. These preclinical studies also show that the device is both safe and highly accurate. However, it has not yet been tested in humans.
Still, if the technology seems futuristic, it may be because tiny wearables and implants that measure any number of biological processes have been themes in science fiction for decades. With refinements underway to improve precision medicine, the future has already arrived. Scientists involved in the project ranged from molecular and cellular biologists to biochemists and a team of bioengineers like Zhu.
One goal in precision medicine has been the development of a minimally invasive device that can monitor the clearance of drugs from a patient’s kidneys and liver, providing more accurate dosing guidelines. To address persistent problems that have impeded progress toward reaching that goal, the team engineered what it calls a “resilient nanostructured bioelectrode” using a microscopically thin layer of a precious metal.
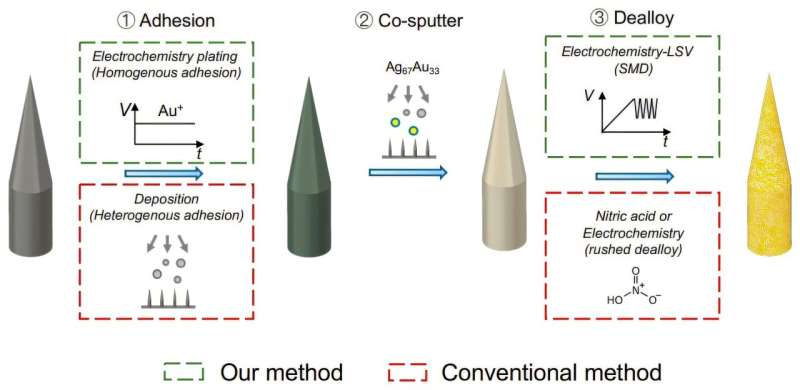
“Our microneedle-based resilient nanostructured bioelectrode is fabricated using a bilayer process that strengthens the electrode with a micrometer-thick gold adhesion layer,” Zhu noted in the research paper.
The key reason that an accurate wearable biosensor is needed is explained by the growing number of medications with narrow therapeutic ranges. That means it is possible to provide doses that are either too low or too high. With a wearable such as the one under development, doctors can tell if they have prescribed a precise dose, and how well the drug is being processed and excreted.
Toward precision monitoring in organ dysfunction
In preclinical experiments, the biosensor enabled continuous in-tissue monitoring of drug pharmacokinetics, including changes associated with liver and kidney dysfunction. Scientists found in the animal model research that their experimental technology measured drug kinetics for six days and produced accurate parameters for drug dosing while also monitoring drug clearance from the liver and kidneys.
The system revealed, for example, that one chemotherapy drug, irinotecan, cleared out slowly in mice with liver damage. The technology also traced the kinetics of several antibiotics during various stages of chronic kidney disease.Comparison between conventional blood-based therapeutic drug monitoring and wearable ISF-based therapeutic drug and metabolic function monitoring. Credit: Science Translational Medicine (2026). DOI: 10.1126/scitranslmed.adr5493
An approach by other research groups has involved the use of wearable biosensors that incorporate microneedles, which measure minute molecular changes in drug concentrations. However, current microneedles suffer from issues such as low sensitivity and poor mechanical durability.
In contrast, Zhu and colleagues developed a more resilient, nanostructured microneedle that analyzes the biochemistry of interstitial fluids between cells. Their design incorporates sensors that endow it with a high degree of specificity and features a strong layer of gold that increases the needle surface area and resists corrosion.
Technology holds promise
In an editorial commentary, Molly Ogle, an associate editor at Science Translational Medicine, notes that wearable technology could play an important role in precision medicine. “The study demonstrates preclinical promise for minimally invasive therapeutic drug monitoring and functional assessment of hepatic and renal drug processing,” Ogle wrote.
Zhu and colleagues underscored, meanwhile, that their device not only has marked improvements over similar technology but also could be economically manufactured. They predict that their resilient nanostructured bioelectrode could be mass produced at less than $1.50 per sensor.
“These results establish the resilient nanostructured bioelectrode as a viable microneedle platform for high-fidelity in vivo deployment of electrochemical biosensors, enabling minimally invasive, longitudinal monitoring of low-concentration analytes and real-time assessment of organ function,” Zhu and the UCLA team concluded.