Weekly Market Review – July 23, 2022

Stock Markets

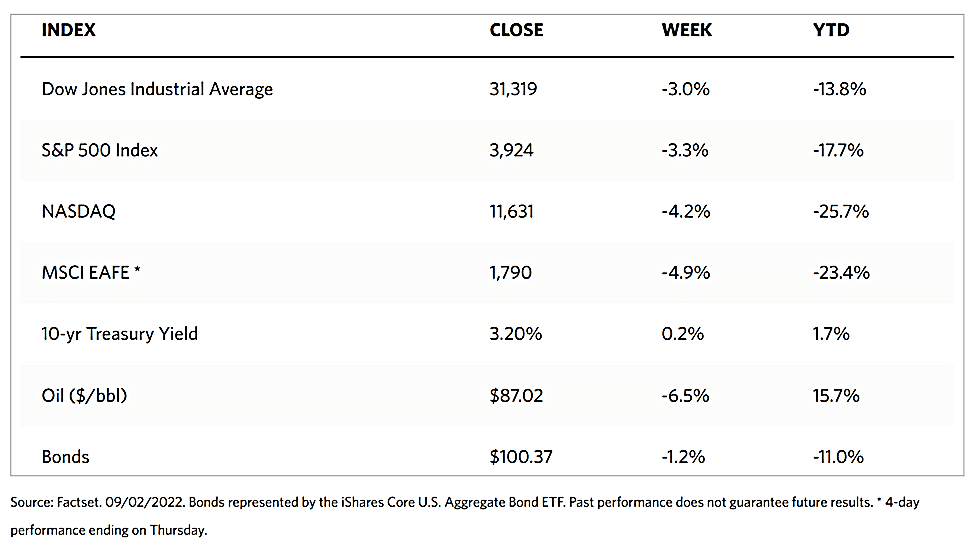
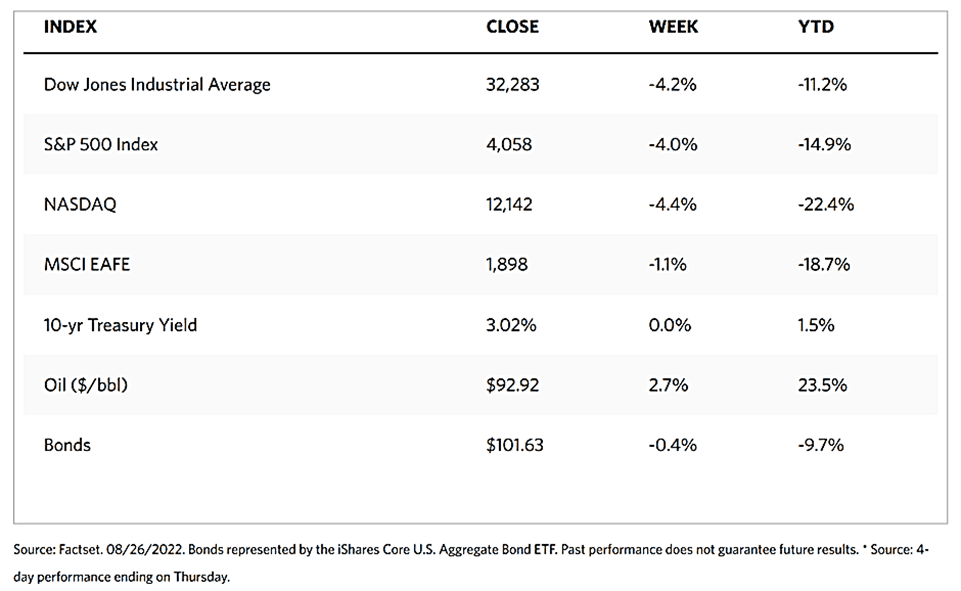
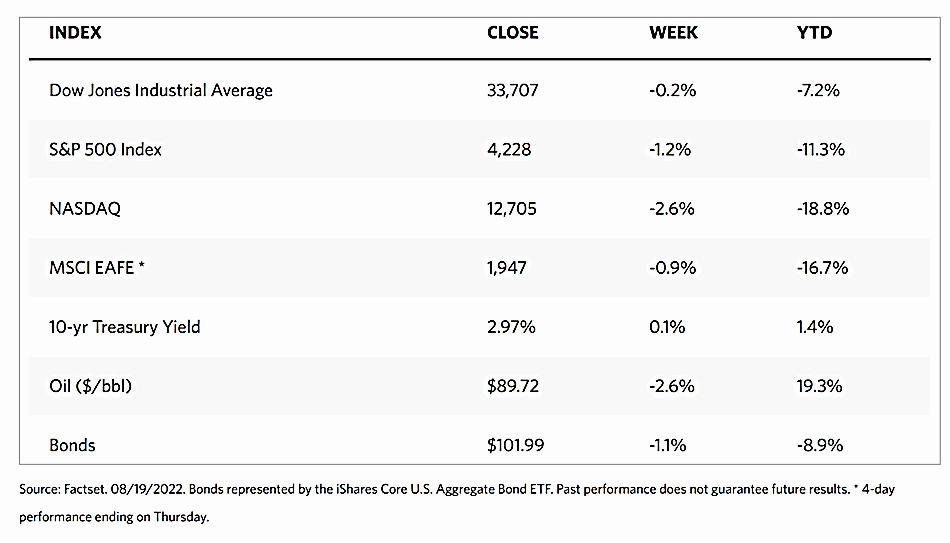
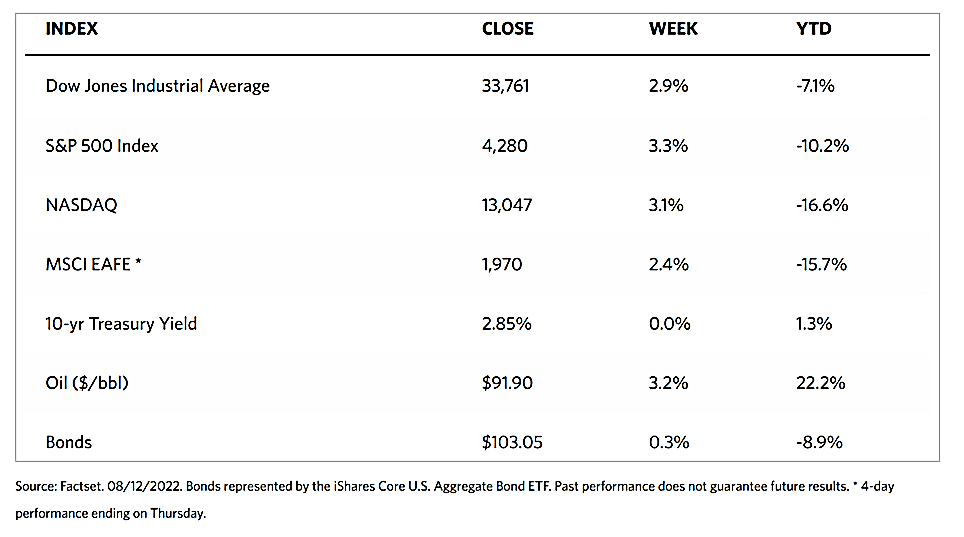
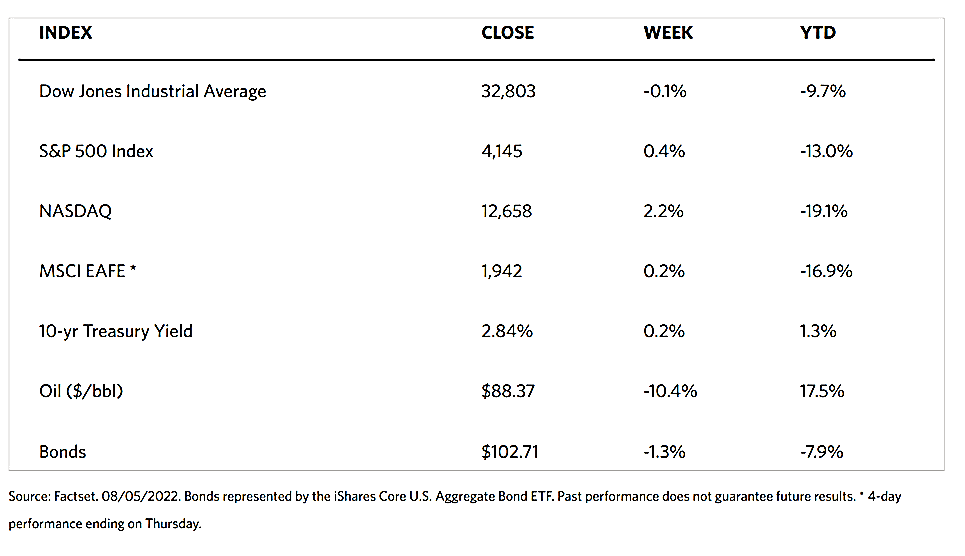
Most indexes were up this past trading week. The Dow Jones Industrial Average (DJIA) was up 1.95% and the total stock market rose 2.76%, although the utility sector underperformed, sliding 0.23%. The S&P 500 Index gained 2.55%, while the Nasdaq Stock Market Composite, the benchmark for technology stocks, rose faster at 3.33%. The NYSE Composite also climbed 2.36%. This constitutes a short-term market rally that added to a run that pushed the S&P 500 up by 9% over last month’s levels. For the year, equities are still 17%, but this week’s rally is a breath of fresh air in a continuing bear market. It is, at best, a brief respite, however, as the economy is not yet out of the woods.

There appears to be a turnaround in sentiment as investors welcome signs that the economy is slowing and inflation concerns may be gradually alleviating. The rise this week shows shares carrying over the momentum from last week. Consumer discretionary shares performed best within the S&P 500 Index as share prices rebounded in Amazon.com and Tesla. Some weaknesses weighed in on Verizon and Alphabet, the parent company of Google, dragging communication services shares down. Aside from a shift in sentiment, investors also were heartened by several prominent second-quarter earnings reports. They indicate that the economy may be slowing, but companies also exhibited a greater resilience in profits and outlooks than analysts have expected. Much of the rally occurred on Tuesday, but later in the week, the indexes pulled back after social media shares fell sharply resulting from a flat increase in advertising revenue in the second quarter.

U.S. Economy

Weak economic data that came out this week briefly pushed the yield on the benchmark 10-year U.S. Treasury note down to 2.73% last Friday, the lowest level it has been in months. The upcoming second-quarter GDP report will give investors and analysts the latest situation on the state of the economy. Although a recession is not assured at present, the risk of a mild contraction appears to have risen appreciably, according to analysts’ readings. There are signs that inflation is peaking, as commodity prices have fallen sharply in recent weeks, providing much-needed relief. Oil prices are down 20% from their recent peak, while copper and lumber prices have receded 32% and 60%, respectively.

Also substantially down are prices of agricultural commodities including wheat, corn, and soybeans. Part of this is due to a UN-supported deal signed by Ukraine and Russia that will allow Ukraine to continue exporting its grain through the Black Sea. This will potentially increase the global food supply since Ukraine is one of the largest agricultural exporters in the world. Wage growth is still healthy but has moderated, possibly influencing inflation levels. Supply chain measures are also showing further improvement through signs of loosening bottlenecks, while PMI readings have slowed to levels consistent with lower cost pressures.

Metals and Mining

The gold market continues its struggle in recent months as the U.S. dollar has continued to rise. Although in the past week, the U.S. currency has retraced from its 20-year high and achieved parity with the euro, there is a strong consensus that it will remain at elevated levels at least for the foreseeable future. But what is good news for gold investors is that despite the strength of the U.S. dollar, it may eventually lose its relevance in global financial markets. There is a genuine fear of recession in the U.S., which threatens to create a stagflationary environment while high inflation persists. In periods of extreme uncertainty, such as this scenario suggests, both gold and the U.S. dollar can rally in tandem as investors look for safe-haven assets to protect their capital. The last time that speculative interest was this low was in May 2019, just preceding a months-long rally that gold embarked upon and which led it to record highs in August 2020.

This past week, gold gained 1.14% from its close in the preceding week at $1,708.17 to its close this week at $1,727.64 per troy ounce. Silver fell 0.59%, from $18.71 the week before to this week’s $18.60 per troy ounce. Platinum began at $851.31 and closed at $876.84 per troy ounce for an increase of 3.00%. Palladium gained 11.40% from $1,830.37 to $2,039.00 per troy ounce. The three-mo prices for base metals generally ended higher for the week. Copper prices moved from $7,190.50 to $7,452.50 per metric tonne for a gain of 3.64% week-on-week. Zinc closed one week prior at $2,915.00 and this week at $2,992.50 per metric tonne, higher by 2.66%. Aluminum gained 5.66% from the earlier week’s close at $2,343.00 to this week’s close at $2,475.50 per metric tonne. Tin slightly gained by 0.39%, from the close one week before at $24,850.00 to the recent close at $24,947.00 per metric tonne.

Energy and Oil

In contrast to the volatility of recent weeks, oil price movements this week were limited. ICE Brent hovered steadily within the $100-$105 per barrel price range. This did not happen merely due to the absence of big stories; it was quite the reverse. Libya returned to the market and the ECB hiked interest rates for the first time in many years. These moves provided significant downside risks for crude. However, prompt crude supply continues to lag demand, with the front months of the Brent and WTI curves exhibiting backwardation that remains as steep as ever. Curiously, this has created a balancing mechanism wherein neither the upside nor the downside is sufficiently strong to pull prices in either direction. In the meantime, oil majors operating in the Permian Basin risk slowing down drilling activity in the area. This is likely due to the Biden government’s proposal to cut smog limits in drilling hotbeds in Texas and New Mexico, above the Federal ozone threshold of 70 ppb.

Natural Gas

Spot prices of natural gas rose at most locations during the report week from July 13 to July 20. Henry Hub spot price rose from $6.63 per million British thermal units (MMBtu) to $7.56/MMBtu for the week. Price increases at major pricing hobs ranged from $0.87 at PG&E Citygate in Northern California to $17.86 at Algonquin Citygate in the Northeast. International natural gas futures prices decreased during the same week. The weekly average futures prices for liquefied natural gas (LNG) cargoes in East Asia descended by $1.02 to a weekly average of $38.11/MMBtu, and natural gas futures for delivery at the Title Transfer Facility (TTF) in the Netherland, the most liquid natural gas spot market in Europe, came down by $4.29 to a weekly average of $47.59/MMBtu.    

World Markets

European stocks ascended on the strength of positive market sentiment, despite a string of discouraging economic data releases and the decision of the European Central Bank (ECB) to raise interest rates for the first time in more than ten years. The pan-European STOXX Europe 600 Index closed the week higher by 2.88% in local currency terms. Italy’s FTSE MIB Index closed up 1.33%, while France’s CAC 40 Index gained 3.00% while Germany’s Xetra DAX Index did slightly better, rising 3.02%. The UK’s FTSE 100 Index rose 1.64%, chalking in a good performance for the week. Core eurozone bond yields fell as economic growth concerns drove demand. The trend gained strength upon the release eurozone Purchasing Managers’ Index (PMI) data suggesting that economic activity contracted in July. UK gilt broadly followed core markets, while peripheral eurozone bond yields moved sideways. Following Prime Minister Mario Draghi’s resignation, the Italian 10-year government bond yield rose but eventually retreated by the end of the week.

Japan’s stock markets climbed during the week. The Nikkei 225 Index surged 4.20% while the broader TOPIX Index gained 3.35%. Consistent with expectations, the Bank of Japan (BoJ) continued to implement its ultra-accommodative monetary policy to support the country’s fragile monetary economy. In so doing, it proceeded to further diverge from the tightening policies of other major central banks. The yield on the 10-year Japanese government bond ended the week at 0.22% which is slightly lower than the previous week’s 0.23%. The yen strengthened to JPY 137.4 against the U.S. dollar, from, JPY 138.5 per dollar the week earlier. The yen continued to remain at close to 24-year lows. BoJ Governor Haruhiko Kuroda attributed this weakness to the rise of the greenback against major and emerging market currencies, rather than the BoJ’s loose policy stance.

China’s bourses were mixed after Premier Li Keqiang moderated expectations of excessive stimulus and indicated flexibility on China’s annual growth target. The broad, capitalization-weighted Shanghai Composite Index gained 1.3%, while the blue-chip CSI 300 Index, which tracks the largest listed companies in Shanghai and Shenzhen, slid 0.2%. Li told world business leaders at a meeting hosted by the World Economic Forum that slightly higher or lower growth rates are both acceptable as long as employment is relatively sufficient, household income continued to grow, and prices are stable. China announced a growth target of about 5.5% for the current year during a Politburo meeting in April, a goal most economists agree will be difficult for China to meet. The yuan eased to CNY 6.764 per U.S. dollar from CNY 6.75 the week before. The 10-year Chinese government bond yield was flat. Outflows from China’s bond market totaled USD 14 billion in June as the surging U.S. Treasury yields reduced the relative attractiveness of Chinese bonds.

The Week Ahead

The Federal Reserve rate decision, real disposable income, and real consumer spending are among the important economic data to be released in the coming week.

Key Topics to Watch

  • Chicago Fed national activity index
  • S&P Case-Shiller national home price index (year-over-year)
  • Consumer confidence index
  • New home sales (SAAR)
  • Durable goods orders
  • Core capital equipment orders
  • Advance report on trade in goods
  • Pending home sales index
  • Fed funds target rate
  • Fed Chair Jerome Powell press conference
  • Gross domestic product, first release (SAAR)
  • Final sales to domestic purchasers (SAAR)
  • Initial jobless claims
  • Continuing jobless claims
  • PCE inflation index
  • Core PCE price index
  • PCE price index (year-over-year)
  • Core PCE price index (year-over-year)
  • Real disposable income
  • Real consumer spending
  • Nominal personal income
  • Nominal consumer spending
  • Employment cost index
  • Chicago PMI
  • UMich consumer sentiment index (final)
  • UMich 5-year inflation expectations (final)

Markets Index Wrap Up

Weekly Market Review – July 16, 2022

Stock Markets

Equities remained volatile in light-volume summer trading. Anticipation over the release of the important inflation data appeared to have kept investors out of the market, but inflation came in higher than expected. The higher-than-expected consumer prices for June pushed consumer inflation to 9.1%, higher than the expected 8.8%, resulting in a new 41-year high. Consumer prices jumped 1.3% in June alone accounted for by the surge in gas prices by 11.2% for the same month. The week also saw the release of the first major second-quarter corporate earnings reports. The S&P 500 descended to its lowest intraday level since June 22 on Thursday morning, but Friday saw it rallying to end the week well off its lows. Among the best performers in the Index were technology stocks mainly due to solid gains in Apple. The energy sector underperformed weighed down by the plunge of international oil prices to levels last seen before the Russian invasion of Ukraine.

For the week, nearly all sectors are down in the S&P 500 Index, which itself dipped 0.93%. The Dow Jones Industrial Average inched down 0.16%, while the Nasdaq Composite, which tracks technology stocks, slipped south by 1.57%. The NYSE Composite was also down 1.32%. The Dow Jones total stock market index dropped by 1.07%.

U.S. Economy

This week and likely for the next few weeks at least, high energy and food prices will continue to drive the story for the markets. The 9.1% CPI reading from a year ago is up from the May CPI indicator of 8.6%. Energy prizes alone rose 42% year-over-year and were up 7.5% from May. The rise in oil prices accounted for more than half of the overall increase in inflation. It is likewise concerning to note that food prices experienced their highest monthly increase since 1981. That being said, commodity prices have fallen sharply since June. Last week, as noted by the energy sector performance, oil prices decline to their lowest level since the advent of the Ukrainian invasion. It briefly traded at $91 before ending the week at $98. In mid-June, gasoline prices were well over $5 a gallon. Since then, it has dropped off to an average of $4.58. The core CPI indicator, which better represents the underlying inflationary trend because it excludes food and energy prices, rose at 5.9% over the past year, down only slightly from the 6.0% reported over the past month. The Federal Reserve is under pressure to continue to hike interest rates as a result of the higher-than-expected inflation reading, heightening fears of an impending recession.

Metals and Mining

Several gold investors are wondering why gold prices have dropped for the last five straight weeks, despite the surge in the inflation rate and a situation where the world is on the brink of a recession. There is one simple reason for gold’s slump. The market is anticipating that the Federal Reserve will maintain its stance to bring inflation under control. This explains why gold prices have fallen more than $100 this week, depreciating nearly 6% and looking to test the critical long-term support level at $1,700. The Fed is expected to continue to aggressively raise interest rates in an attempt to slow inflation and, subsequently, the demand for consumer goods, thus slowing the economy. The Fed’s stance is driving real yields higher even while consumer prices rise to a 40-year high. Gold is a traditional inflation hedge, but investors do not need a hedge if inflation comes under control. Gold may be down, but it is certainly not out. With a recession possibly on the horizon, gold may well find new buying incentives if investors begin to doubt the Fed’s credibility and commitment to inflation control should economic growth begin to falter.

Precious metals are down this week. Gold fell further from its prior week’s close at $1,742.48 to $1,708.17 per troy ounce, down by 1.97%. Silver is also down from its previous close at $19.32 to this week’s close at $18.71 per troy ounce, a loss of 3.16%. Platinum gave up 4.86% of its value one week before at $894.76 to this week’s $851.31 per troy ounce. Palladium is also down by 15.30%, from the prior week’s $2,160.96 to this week’s $1,830.37 per troy ounce. The 3-month prices of base metals did not fare better. Copper, previously at $7,805.50, closed this week at $7,190.50 per metric tonne, down by 7.88%. Zinc came from $3,099.00 and ended at $2,915.00 per metric tonne for a loss of 5.94%. Aluminum slipped from its previous weekend price of $2,436.50 to this week’s close at $2,343.00 per metric tonne, down by 3.84%. Tin went down by 2.03% from the earlier week’s $25,364.00 to $24,850.00 per metric tonne.

Energy and Oil

The oil market observers have become watchers of the world macroeconomy as the price swings of oil became increasingly dependent on the broader market sentiment. This week just ended was in most part influenced by the market anticipating a 100-basis-point hike, thus sending all global crude oil benchmark prices plunging by double digits. However, when the U.S. Federal Reserve instead decided to hike interest rates by only a modest 75 basis points, ICE Brent quickly recovered back to $102 per barrel. It seems there is still no consensus on the main driving trend in the markets after the recent hedge fund sell-off. The fears that an economic recession may materialize remain pronounced and just as strong as the sentiment of immediate physical tightness. Despite the present visit by the American President to Saudi Arabia, senior U.S. officials admit that they do not expect Riyadh to immediately boost crude production, thus lifting crude prices by $2 per barrel in Friday’s trading. 

Natural Gas

For the report week beginning July 6 and ending July 13, 2022, natural gas prices generally moved sideways on listless trading, The Henry Hub spot price rose from $5.63 per million British thermal units (MMBtu) to $6.63/MMBtu, a week-on-week increase of $1. Regarding futures prices, the price of the August 2022 NYMEX contract rose $1.179, from $5.510/MMBtu to $6.689/MMBtu throughout the week. The price of the 12-month strip averaging August 2022 through July 2023 futures contracts ascended $0.812 to $5.834/MMBtu. At most locations during this report week natural gas spot prices rose. Increases ranged from $0.77 at Eastern Gas south in the Appalachia production region to $2.26 at SoCal Citygate in Southern California. In the domestic market, the average total supply of natural gas fell by 0.1% compared with the previous report week. Dry natural gas production decreased by 0.5% compared with the previous week. Total U.S. consumption of natural gas rose by 2.5% compared with the previous report week. Natural gas consumed for power generation increased by 5.0% week over week. U.S. LNG exports increased by four vessels this week compared to last week.

World Markets

In Europe, equities markets moved sideways to slightly lower. Central banks further hiked interest rates, raising concerns that a global recession may indeed materialize. During the five trading days ending on July 15, the pan-European STOXX Europe 600 Index closed 0.80% lower in local currency terms. Italy’s FTSE MIB lost 3.86%, Germany’s DAX dropped 1.16%, and France’s CAC 40 gained a marginal 0.05%. the UK’s FTSE 100 Index slid 0.52% down. Core eurozone bond yields fell due to worries that a cutoff of Russian gas might push European economies into a recession. As a result, markets tempered their expectations for policy tightening, causing core bonds to rally. UK government bond yields followed core markets and peripheral eurozone bond yields ended broadly level. Italian 10-year bond yields broadly tracked core bonds earlier in the week, but sold off after Italy’s ruling coalition collapsed. The euro broke below parity with the U.S. dollar for the first time in 20 years due to fears of a recession intensifying.

The stock markets in Japan rose for the week, with the Nikkei 225 Index climbing 1.02% and the broader TOPIX Index closing 0.27% higher. Japan mourned the passing of its former and longest-standing prime minister, Shinzo Abe, who was shot and killed on July 8 while campaigning for the parliamentary upper house election. World leaders offered their condolences. On July 10, the ruling Liberal Democratic Party (LDP) increased its seat count in the election. It won a majority with its coalition partner Komeito, signaling strong support for Prime Minister Fumio Kishida of the LDP. This also strengthened the government’s policy priorities, and its focus on lifting growth will likely remain unchanged. The Bank of Japan (BoJ) reiterated its commitment to the ultra-loose monetary policy it had been pursuing. The yield on the 10-year Japanese government bond dipped to 0.23% from last week’s 0.24%. The yen weakened to JPY138.8 against the U.S. dollar from last week’s JPY 136.1, after hitting a fresh 24-year low during the week.

China’s stock markets consolidated as data showed that the country’s economy slowed dramatically in the second quarter. Also, property and banking shares were hurt by a growing movement among homebuyers to stop paying their mortgages. The broad, capitalization-weighted Shanghai Composite Index declined by 3.8%, while the blue-chip CSI 300 Index, which tracks the largest listed companies in Shanghai and Shenzhen, plunged by 4.1%. The country’s GDP for the second quarter grew at a worse-than-expected rate. It registered 0.4% from one year earlier, compared to the 4.8% expansion in the first quarter. Friday’s GDP followed reports of a rapidly growing number of Chinese homebuyers who refused to pay mortgages for unfinished construction projects. As of Wednesday, homebuyers have halted mortgage payments on at least 100 projects in more than 50 cities across the country as of Wednesday, a sharp increase from just a few days earlier. Among other economic data, Industrial production grew 3.9% in June from one year earlier, up from May’s 0.7% increase, while fixed asset investment increased 6.1% in the first six months of the year from comparative figures last year. Retail sales surged 3.1% year-on-year in June, beating analysts’ expectation of flat growth after May’s 6.7% drop.

The Week Ahead

The important economic data scheduled for release in the coming week include building permits on Tuesday and the LEI index on Thursday.

Key Topics to Watch

  • NAHB home builders’ index
  • Building permits (SAAR)
  • Housing starts (SAAR)
  • Existing home sales (SAAR)
  • Initial jobless claims
  • Continuing jobless claims
  • Philadelphia Fed manufacturing index
  • Leading economic indicators
  • S&P Global U.S. manufacturing PMI (flash)
  • S&P Global U.S. services PMI (flash)

Markets Index Wrap Up

Weekly Market Review – July 9, 2022

Stock Markets

The markets were generally up over the past week. The Dow Jones Industrial Average (DJIA) gained 0.77% from the previous week’s close, while the broader S&P 500 Index rose by 1.94%. The technology tracker Nasdaq Composite rose 4.56%, signaling that most of the rebound took place in the technology sector. Within the Dow Jones, the only sector to pull back was utilities whose average lost 3.08%. The general optimism that reigned this week stemmed from the perception that the Federal Reserve will be able to control inflation without plunging the economy into a recession. The S&P 500 Index gains pulled it out of the bear market such that at Friday’s close of trading it was down only 19.1% from its January peak.

The Nasdaq Composite gained the most among the indexes. This is due to the surge among the large communication services and information technology sectors which, together with consumer discretionary, outperformed the other sectors. On the other hand, the drop in the utilities was the result of a sharp fall in energy shares on Tuesday (the markets were closed on Monday in observance of Independence Day) following the drop in domestic oil prices. Oil fell below $100 per barrel for the first time in almost two months, but it rallied, together with crude prices, later in the week.

U.S. Economy

Last week’s release of economic data dominated investor sentiment as investors struggled to assess the likely repercussions of the currently restrictive Fed policy. On Wednesday, the final estimates of services activity in June were each released by S&P Global and the Institute of Supply Management (ISM), both versions of which came in slightly above the consensus estimate even as they also indicated a continuing slowdown in growth. The measure used by the ISM in its assessment hit its lowest level since June 2020, while its employment metric was well into contraction territory for the third time this year.

The main focus of most analysts, however, revolved around the labor market. Last Friday, the June jobs report released showed that the employment situation is relatively favorable, all else considered. In June 372,000 jobs were added to the economy, raising the three-month average to 375,000, which is inconsistent with a coming recession. Furthermore, the unemployment rate held at 3.6% for the fourth month in a row, which is close to the 50-year low. Again, this does not signal a coming recession, since historically, the unemployment rate has climbed about half a percent before recessions began. The initial jobless claims have inched higher in the past weeks, which may signal some upcoming weakness in hiring trends. At present, however, the job market situation does not appear to support either one side or the other on the recession speculation.

Metals and Mining

The gold market has seen an almost 4% drop since May when it experienced its biggest selloff. Investors are hoping that this recent plunge has shaken out some of the complacent long-term holders that still linger in the marketplace. Many players have been waiting for the shakeout of this overhang supply and are looking forward to adding to their long-term bullish bets. There is, however, the opposing view that this recent drop may just be the beginning of a bigger move as gold faces some major headwinds. The greatest barrier faced by the precious metal is the possibility that the Federal Reserve may continue to aggressively raise interest rates. Investors already anticipate that the Fed may increase interest rates by an additional 75 basis points by the end of July. This expectation has driven the U.S dollar to a 20-year high and pushed bond yields back above 3%. Should this materialize, it would tend to drive gold prices down since gold is a non-yielding asset. On the other hand, it may also make gold more attractive as a safe haven asset.

This past week, gold lost 3.81% of its value, from the previous week’s $1,811.43 to this week’s close at $1,742.48 per troy ounce. Silver descended 2.82% from $19.88 the week earlier to $19.32 per troy ounce this week. Platinum gained slightly from $892.74 to $894.76 per troy ounce for a week-on-week increase of 0.23%. Palladium rose substantially from its previous close at $1,959.58 to this past week’s end at $2,160.96 per troy ounce, a gain of 10.28%. The 3-mo prices of base metals were mixed. Copper began at $8,048.00 and closed the week at $7,805.50 per metric tonne, a loss of -3.01%. Zinc, which ended the previous week at $3,029.00, closed this week at $3,099.00 per metric tonne, for a gain of 2.31%. Aluminum began at $2,444.00 and closed at $2,436.50 per metric tonne, a loss of 0.31%. Tin, which closed a week ago at $26,650.00, closed this week at $25,364.00 per metric tonne, for a weekly loss of 4.83%.

Energy and Oil

The oil price collapse on Tuesday may be one of the oil industry’s most memorable developments of this tumultuous year. It was the third-largest daily loss since the onset of the oil exchanges. Furthermore, declining crude did not impact any changes along the futures curve. The implication is that the large drop in oil price was mainly due to widespread profit-taking. Primarily non-physical participants panicked at the thought of recession descending upon the markets sooner than anticipated. According to the balances, however, the markets are still contending with extremely tight supply. Although it might take some time, the physical side of the scale will likely push prices back soon.

Natural Gas

At most locations this report week, June 29 to July 6, natural gas spot prices fell. The Henry Hub spot price dropped from $6.67 per million British thermal units (MMBtu) at the beginning of the report week to $5.63/MMBtu by the week’s end. International spot prices for natural gas increased, however. The weekly average swap prices for liquefied natural gas (LNG) cargoes in East Asia ascended $1.56 to a weekly average of $38.43/MMBtu. The prices at the Title Transfer Facility (TTF) in the Netherlands, which is Europe’s most liquid natural gas spot market, the day-ahead price increased by $7.62 to a weekly average of $47.99/MMBtu. In the corresponding week last year, (week ended July 7, 2021), the prices in East Asia and at TTF were $13.17/MMBtu and $12.27/MMBtu, respectively. The weekly average premium of TTF prices to East Asia this report week was $9.56/MMBtu, the highest such premium since the second week of March, following Russia’s full-scale invasion of Ukraine.

In the domestic market, prices in the Midwest fell with the national average while prices along the Gulf Coast fell with moderate temperatures. Prices across the West fell as temperatures along the West Coast and across the Rocky Mountains remained moderate. In the Northeast, prices declined ahead of lower temperatures and ample pipeline capacity. The U.S. natural gas supply increased slightly week-over-week while natural gas demand rose as a result of temperature swings across the country. U.S. LNG exports increased by one vessel this week from last week.

World Markets

European shares rallied in the first week of July following three straight months of losses. The gains appear to be restrained, however, by the reimposition of some coronavirus restrictions by China apparently to restrain any further spread of the virus. There were also ongoing worries that further energy shortages may cause a recession in Europe. The pan-European STOXX Europe 600 Index closed the week 2.45% higher in local currency terms. Italy’s FTSE MIB Index gained 1.96%, France’s CAC 40 Index climbed 1.72%, and Germany’s Xetra DAX Index ascended 1.58%. The UK’s FTSE 100 Index added 0.38%. Core eurozone sovereign yields did not change substantially. German bund yields, however, began to climb after better-than-expected employment figures were released in the U.S. on Friday morning. UK gilt rates significantly rose this week.

Japan’s stock markets charted gains during this week. The Nikkei 225 Index rose 2.24% while the broader TOPIX Index gained 2.30%. Regarding the fixed income markets, the yield on the 10-year Japanese government bond (JGB) climbed to 0.24% from 0.23% at the end of the week before. In June, the Bank of Japan (BoJ) established a monthly record in its JGB purchases as it attempted to slow the rise in long-term yields above the 0.25% cap it has set under its policy of yield curve control. The dovish stance of the central bank has created pressure on the yen, which weakened to approximately JPY 135.90 against the U.S. dollar, from FPY 135.22 the prior week, still languishing at its lowest levels in 24 years. The firm commitment of the BoJ to its policy of monetary easing contrasts significantly with the tightening stance of other central banks in the world in their attempts to stem inflation. Although consumer prices have trended upward in Japan, inflation remains low compared with other developed countries.

Chinese stocks pulled back slightly due to concerns about rising coronavirus cases and rising geopolitical tensions. Both the broad, capitalization-weighted Shanghai Composite Index and the blue-chip CSI 300 Index, which tracks the largest listed companies in Shanghai and Shenzhen, lost 1% of their value. China’s coronavirus caseload went up to 478 on Thursday from Wednesday’s 409 count, mostly detected in the eastern province of Anhui. The population of this province that is in lockdown is more than 1 million people located in small towns. In Jiangsu and other provinces, dozens of new cases are also appearing. Shanghai, which just ended a two-months-long lockdown, faces a “relatively high” risk of elevated community COVID-19 transmission, according to health officials on Friday, In geopolitics, Sino-U.S. tensions increased after a senior Chinese military officer warned his U.S. counterpart that any “arbitrary provocations” would be met with a “firm counterstrike” by China. The yuan currency remained steady at CNY 6.70 per U.S. dollar. The 10-year Chinese government bond yield rose slightly to 2.858% from 2.847% one week prior.

The Week Ahead

The CPI index, the PPI index, and initial and continuing jobless claims are among the important economic data expected to be released in the coming week.

Key Topics to Watch

  • 3-year inflation expectations
  • New York Fed President John Williams discusses move away from LIBOR
  • NFIB small business index
  • Richmond Fed President Tom Barkin speaks
  • Consumer price index (monthly)
  • Core CPI (monthly)
  • CPI (year-over-year)
  • Core CPI (year-over-year)
  • Beige book
  • Federal budget (comparison vs. year-ago)
  • Producer price index final demand (monthly)
  • Initial jobless claims
  • Continuing jobless claims
  • Fed Gov. Chris Waller speaks
  • Retail sales
  • Retail sales excluding vehicles
  • Import price index
  • Empire State manufacturing index
  • Atlanta Fed President Raphael Bostic speaks
  • Industrial production index
  • Capacity utilization
  • UMich consumer sentiment index (preliminary)
  • UMich 5-year inflation expectations
  • Business inventories

Markets Index Wrap Up
Weekly Market Review – July 2, 2022

Stock Markets

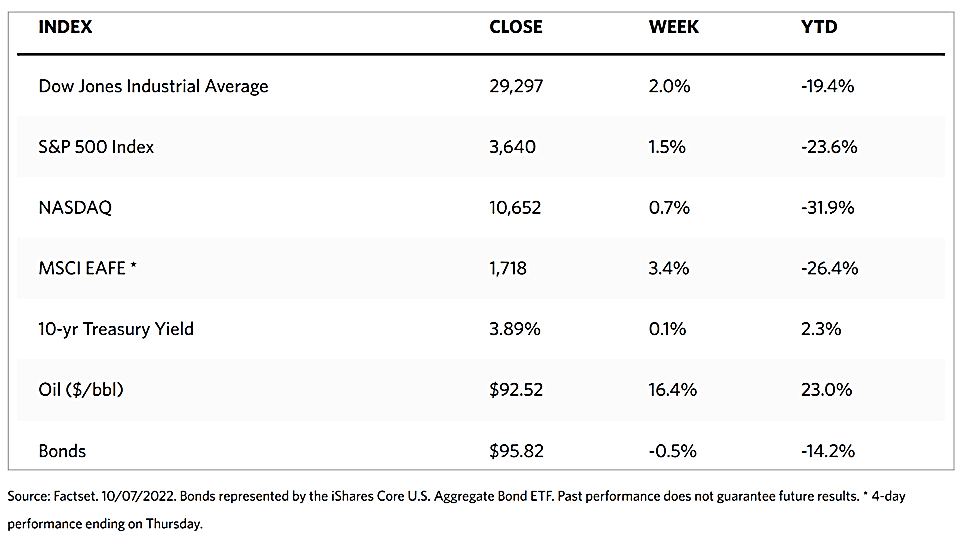
Over the week just concluded, the stock markets showed took a further dip ahead of a long holiday weekend. The Dow Jones Industrial Average (DJIA) closed 1.28% lower week-on-week with all sectors down except for the utility sector which managed to average 4.09% up. The S&P 500 Index closed 2.21% down, while the Nasdaq stock market composite also slid 4.13%. The New York Stock Exchange (NYSE) Composite lost 1.18% for the week. The slight pullback may be seen as a correction following the strong gains over the preceding week. It may also be attributed to worries that the Federal Reserve’s aggressive attempts to control inflation may push the economy into a full recession. The S&P 500 suffered its worst first semester since 1970, with the decline being highlighted by the index ascending to its all-time high on January 3 this year. Those segments within the index regarded as typically defensive, namely utilities and consumer staples, were most resilient, while information technology and consumer discretionary shares were the weakest. The market will remain closed on Monday in celebration of the Fourth of July, Independence Day. Inflation worries remain front and center for investors, but the financial sector seems to be looking ahead to a potential economic slowdown or likely recession.

U.S. Economy

A survey of the four financial markets – equities, bonds, commodities, and currencies – appears to be signaling a slowdown in economic growth ahead, although this may be part of a bottoming process. Market reactions are forward-looking and tend to be leading indicators, with market corrections followed by slowing economic data and a downward revision in earnings data. There are already signs of economic fundamentals softening in the form of a simultaneous descent in consumer confidence, PMIs, and retail-sales data. In the months ahead, earnings forecasts are likely to be adjusted downwards, resulting in the formation of a more rounded U-shaped bottom, rather than a sharp V-shaped curve.

In the meantime, most of the economic data released during the week fell short of consensus expectations. The week’s sell-down began on Tuesday just as the Conference Board’s index of consumer confidence registered much lower than expected. Also, manufacturing activity metrics in the mid-Atlantic region plummeted to levels not seen since the peak of the pandemic.  Data on May personal consumption expenditures (PCE) were released on Wednesday, also indicating that consumers were also retreating. May purchases fell 4.0% when adjusted for inflation, the first time this important indicator declines in 2022. The move was driven by a 1.6% decline in good purchases, and while purchases of services rose a marginal 0.3%, much of the increase was propelled by spending on housing and health care. Inflation-adjusted disposable income reported on Thursday saw a decrease of 0.1% over the month.

There were still some welcome developments, however. Much of the week’s data pointed towards a lowing but continued expansion. May durable goods orders were better than expected when controlling for defense (0.6% versus approximately -0.5%). Measures of current factory activity pointed to continued expansion, albeit at the slowest rate since summer 2020. Weekly jobless claims aligned roughly with expectations at 231,000, as the indicators continued within the narrow band between 231,000 to 232,000 that had been maintained for four consecutive weeks. Claims hit their lowest at 181,000 for the week ended April 24. The silver lining that greeted investors, however, was a downside surprise in inflation signals. The inflation gauge preferred by the Fed is the core PCE price index (discounting food and energy), which came in at 4.7% for the 12 months ending May, slightly below expectations and the lowest level since November. Together with the sluggish economic data, this yelped push the 10-year U.S. Treasury Note benchmark yield to as low as 2.79% on Friday, its lowest level in a month, resulting in higher bond prices.

Metals and Mining

The gold market continued to tread above its strong support at $1,800 per ounce, but only barely after a sharp selloff early on Friday. Recession fears continued unabated together with geopolitical instability, equity market volatility, and inflation pressures, prompting investors to hold gold as a safe haven asset. The market appears convinced, however, that interest rates are likely to proceed upward for the rest of the year, making gold unattractive because it promises no yield. More tough talk from Federal Reserve Jerome Powell convinced investors that he is willing to risk a recession in an attempt to control inflation by raising interest rates. A further downside in gold is indicated by Friday’s preliminary data showing the European Consumer Price Index rising to 8.6% in June, overshooting the 8.1% rise in May and higher than the expected 8.4%. This foreshadows growing pressure on the ECB to start increasing rates and the markets are pricing in a rate hike later this month.

Gold moved sideways from its previous close at $1,826.88 to this week’s $1,811.43 per troy ounce, down slightly by 0.85%. Silver came down 6.05%, from last week’s close at $21.16 to this week’s close at $19.88 per troy ounce. Platinum also went south from $911.08 to $892.74 per troy ounce, a downward correction of 2.01%. Palladium       bucked the trend for precious metals, beginning at $1,882.75 and closing the week at $1,959.58, up by 4.08%. Among 3-mo prices of base metals, copper, which previously closed at $8,381.00, went further down to $8,048.00 per metric tonne, losing 3.97%. Zinc came from $3,350.00 to end at $3,029.00 per metric tonne for the week, down by 9.58%. Aluminum closed the previous week at $2,456.00 and this week at $2,444.00 per metric tonne, only slightly down by 0.49%. Tin came from $24,590.00 to close this week at $26,650.00 per metric tonne, a week-on-week gain of 8.38%.

Energy and Oil

Uncertainty continues to build around OPEC+ supply capacity as demand continues to rise unabated despite speculations of demand destruction. OPEC+ in its recent summit greed to maintain a 648,000 barrel per day increase in its August production target. This has kept its commitment unchanged despite the increasing evidence that the oil group’s spare capacity has thinned to its lowest level in years. Oil markets are buoyed by bullish sentiments, driven further by an additional supply disruptor in the form of strikes. At France’s Fos Refinery, operations were halted by strikes. Norway’s offshore production was similarly heavily impacted. The oil market is seemingly under siege from all directions, including fundamental tightness, underinvestment, Ukraine ware disruptions, and now, work stoppages due to labor disputes.  

Natural Gas

For this report week, June 22 to June 29, natural gas spot price movements were mixed. The Henry Hub spot price rose to $6.67 per million British thermal units (MMBtu) by the week’s end, from $6.59/MMBtu at the beginning of the week. Also increasing this report week are international spot prices, with the weekly average swap prices for liquefied natural gas (LNG) cargoes in East Asia increasing by $4.58 to a weekly average of $36.87/MMBtu. In the Netherlands at the Title Transfer Facility (TTF), Europe’s most liquid natural gas spot market, the day-ahead price increased by $3.29 to a weekly average of $40.37/MMBtu. The price for the same week last year (week ending June 30, 2021) in East Asia was $12.75/MMBtu and $11.57/MMBtu at TTF.

In the U.S., prices rose slightly along the Gulf Coast even as temperatures moderated. In the Midwest, prices remained essentially unchanged while temperatures fluctuated. Prices across the West are mixed, with above-normal temperatures across the Rocky Mountains and along the coast. Along with temperatures and demand for natural gas, Northeast prices increased. U.S. natural gas supply increased slightly week over week, while the country’s natural gas demand remained unchanged, as changes in demand across consumption sectors offset each other. U.S. LNG exports decreased by one vessel this week from last week.

World Markets

European stock markets lost ground on continuing fears that inflation will continue to rise unabated, with the resultant increase in interest rates hitting earnings and tipping economies into a recession. The pan-European STOXX Europe 600 Index closed the week 1.40% lower in local currency terms. Italy’s FTSE MIB plunged 3.46%, France’s CAC 40 dropped 2.34%, and Germany’s DAX Index lost 2.33%. The UK’s FTSE 100 Index dipped 0.56%, supported by a softer British pound against the U.S. dollar. When the pound falls, UK stocks tend to perform comparably well since many companies that form part of the FTSE 100 Index are multinational companies reaping revenues from overseas markets, rendering their earnings more resilient. Core eurozone bond yields decreased in reaction to speeches by central bank officials at the European Central Bank (ECB) annual meeting, reversing their initial increase. Lower-than-expected German inflation figures calmed investors’ fears, leading yields lower overall. UK government and peripheral eurozone bond yields tracked core markets in general.

Japan’s stock markets followed the direction of other international bourses this week, The Nikkei 225 Index lost 2.10% and the broader TOPIX Index fell 1.16%. The slump was due to the escalating risk of a global recession resulting from the aggressive rate hikes by the world’s major central banks in a bid to control inflation.  Japan’s large manufacturers are growing increasingly pessimistic and a bigger-than-expected drop in industrial production further weighed down investor sentiment. In the meantime, the Japanese government warns of power shortages and possibly a renewed reliance on nuclear reactors for energy supply. In light of this, the yield on the 10-year Japanese government bond ended the week broadly unchanged at 0.23%. The yen still hovers close to a 24-year low against the U.S. dollar, a weakness that may be attributed to the divergent monetary policies of the Bank of Japan and the U.S. Federal Reserve. The exchange rate ended the week at the low end of the JPY 135 range. Factory output falls sharply as sentiment among large manufacturers worsens.

China’s stock markets charted gains, prompted by strong factory data and easing coronavirus restrictions for travelers. The broad, capitalization-weighted Shanghai Composite Index rose 1.3%. The blue-chip CSI 300 Index, which monitors the largest listed companies in Shanghai and Shenzhen, climbed 1.6%. On Tuesday, China reduced by half the quarantine times for inbound travelers. The new policy requires travelers to spend seven days in a quarantine facility after which their health should be monitored at home for three days. This is a vast improvement over the 14 days previously required for hotel quarantine in many parts of the country, and as many as 21 days of solation in the past. The current pandemic strategy, according to China’s President Xi Jinping, was “correct and effective and must be upheld unwaveringly.” The yuan currency depreciated to CNY 6.70 against the U.S. dollar late Friday, from CNY 6.69 the week before. The 10-year Chinese government bond yield rose slightly from 2.816% to 2.847% week-on-week as issuance increased. The sale of Chinese local government bonds for June is expected to reach a single-month record high of CNY 1.93 trillion.  

The Week Ahead

Unemployment, average hourly earnings, and consumer credit are among the important economic data to be released this week.

Key Topics to Watch

  • Factory orders
  • Core capital equipment orders revision
  • S&P Global U.S. services PMI (final)
  • ISM services index
  • Job openings
  • Quits
  • FOMC minutes
  • Initial jobless claims
  • Continuing jobless claims
  • Foreign trade balance
  • St. Louis Fed President James Bullard speaks
  • Fed Gov. Christopher Waller speaks at NABE conference
  • Nonfarm payrolls (monthly change)
  • Unemployment rate
  • Average hourly earnings
  • Labor force participation rate, ages 25-54
  • Wholesale inventories revision
  • Consumer credit

Markets Index Wrap Up

.

Weekly Market Review – June 25, 2022

Stock Markets

Over the holiday-shortened trading week (markets were closed on Monday in observance of Juneteenth), investors were encouraged by signs that inflation might be moderating, cooling the overheating economy. The sentiment helped stocks regain lost ground and rally sharply. The Dow Jones Industrial Average (DJIA) gained 5.39% while the S&P 500 Index surged by 6.45%, lifting it out of bear market territory. The Nasdaq Composite, which tracks technology companies, rallied by 7.49%. The Russell 3000 index likewise gained 6.53%. Almost every sector registered strong gains, except for the energy sector as oil continued to retreat from its recent highs for most of the week.

Although stocks rallied across the board last week, they remain down almost 20% for the first six months of the year, the worst semi-annual performance of any year since 1970. This was due to a rapid adjustment in interest rates, valuations, and sentiment brought about by the aggressive central bank tightening, inflation concerns, and the combined effect of these two factors on economic growth. On the other hand, the year-to-date sell-off in stocks and bonds has significantly improved returns for long-term investors.

U.S. Economy

After the economy grew by 5.7% in 2021, the U.S. economy commenced the year from a position of strength. Pent-up consumer demand supported a positive outlook that prevailed after the pandemic headwinds gradually died down. Corporate and household finances were solid and the labor market was robust. Inflation pressures lingered, however, exacerbated by the invasion of Ukraine and the return to lockdowns in China. It started to eat into personal disposable income and savings, forcing the Federal Reserve to signal a shift towards a more aggressive rate-hike strategy. This resulted in an unexpected contraction in the first-quarter GDP, driven by a drag from exports and a decline in inventory spending. Consumer spending, accounting for almost 70% of U.S. GDP, continued to expand at an unrelenting pace. For the second quarter, the real-time estimate of GDP from the Atlanta Fed currently registers 0% growth. In case the second quarter shows a further GDP contraction, this will meet the technical definition of a recession. But an “official” recession is to be designated by the NBER Business Cycle Dating Committee, which at this point does not seem to be the case for the first half of the year, as there does not appear to be any sign of a widespread downturn in economic activity or the labor market.

Moving into the second semester, there will likely be a further deceleration in demand, due to reaction by consumers and businesses to the sharp rise in borrowing costs. The interest-rate-sensitive sectors such as housing and automobiles are already slowing in anticipation of the aggressive measures taken by the Fed, while the broader economy will tend to slow at a lag to the full impact of Fed policy. Mortgage applications are already in a downtrend, even as existing home sales have declined in the last four months, The tight labor market and household savings will continue to support growth. Applications for unemployment benefits (initial jobless claims) have, however, been slowly increasing over the last two months. Companies are also taking a more cautious approach towards hiring under this regime of higher costs and slowing demand. At present, job openings are still twice the number of unemployed workers, but in time this may change as the downside risks to inflation gradually increase. Although the factors driving inflation are beyond the Fed’s control, the sharp rise in rates will continue to impact demand, economic activity, and eventually, inflation.  

Metals and Mining

Due to the Fed’s aggressive response to inflationary pressures, it appears as if the strategy is working and long-term expectations have slightly descended. The University of Michigan released the result of its revised consumer sentiment survey that indicated five-year expectations falling back to approximately its historical average of 3.1% from the previous estimate of 3.3%. This data point has become an important number to watch since apparently it caused the Fed to raise interest rates by 75 basis points during its meeting earlier this month. The inflationary push has appeared to somewhat ease, causing the U.S. central bank to slow future interest rate hikes.  All this activity has not caused any significant changes in the demand for gold and other precious metals. Although the price of gold continues to be well-supported at $1,800 per ounce, there does not appear to be any sense of urgency for investors to rush to buy gold as a safe-haven asset. With so much uncertainty in the economy, the gold market appears satisfied to hold within its present consolidation range, a sign that investors are waiting for the time to strike which, analysts say, may come at the end of the year.

This past week, the gold spot price moved from $1,839.39 to $1,826.88 per troy ounce, losing 0.68% in sideways trading. Silver shifted from $21.67 to $21.16 per troy ounce, a decline of 2.35%. Platinum lost 2.45% as it traded down from last week’s close at $933.98 to $911.08 per troy ounce this week. Palladium, which ended last week at $1,818.61, closed this week at $1,882.75, higher by 3.53%. The 3-month prices of base metals generally moved downwards. Copper began at $8,961.50 and ended the week at $8,381.00 per metric tonne, a downward adjustment of 6.48%. Zinc came down 4.92% from $3,523.50 to $3,350.00 per metric tonne. Aluminum descended from $2,498.00 to $2,456.00 per metric tonne, losing 1.68% for the week. Tin lost 21.15% week-on-week, from the previous week’s close at $31,184.00 to last week’s close at $24,590.00 per metric tonne.

Energy and Oil

Preliminary estimates of the oil data report by the Energy Information Administration (EIA) point to the largest crude stock build in the past four months, which the EIA still has to explain. The U.S. Federal Reserve’s focus on inflationary measures squeezed speculators out of the Brent and WTI futures contracts. As a result, despite backwardation being nearly as steep as it was in March, oil prices have barely moved this past week, leaving the ICE Brent around the $112 per barrel mark. In Europe, the EU leaders focused on the need to seek alternative supplies during this week’s meeting. The leaders were well aware that it is only a matter of time before Russia shuts down all gas shipments to Europe, thus the need to seek alternative supplies as the continent’s 40% dependence threatens the viability of its energy-hungry industry. Meantime, in the U.S., the EIA data shows that the country’s refinery capacity fell below the 18 million barrel-per-day mark at the start of 2022 (reading was 17.94 million b/d). This is the lowest level of operable downstream capacity since 2014.

Natural Gas

Natural gas spot prices descended at most locations for the report week June 15 to 22, 2022. The Henry Hub spot prices slid from $7.72 per million British thermal units (MMBtu) at the start of the week to $6.59/MMBtu by the week’s end. International natural gas spot prices increased during the same week, with the weekly average swap prices of liquefied natural gas (LNG) cargoes in East Asia increasing by $9.20 to a weekly average of $32.29/MMBtu. At the Title Transfer Facility in the Netherlands, the most liquid natural gas spot market in Europe, the day-ahead price increased by $9.38 to a weekly average of $37.07/MMBtu. By comparison, in the same week last year (week ending June 23, 2021), the prices in East Asia and the TTF were $11.88/MMBtu and $10.52/MMBtu, respectively.

In the U.S., prices along the Gulf Coast fell although temperatures remain above normal in the region. Prices in the Midwest fell in line with the national average as temperatures fluctuated. Across most of the West, prices declined as temperatures returned to near normal, while prices in Southern California remained at elevated levels. In the Northeast, prices decreased with the national average. U.S. natural gas supply decreased week-over-week as net imports from Canada fell. U.S. natural gas demand increased as high-consumption regions along the East and West coasts cooled to below normal, even as temperatures remain above normal across much of the central United States. U.S. LNG exports decreased by three vessels this past week compared to the week prior.

World Markets

European stock markets broke three consecutive weeks of losses. Signs that the economy is cooling have cast doubt on whether central banks would continue to raise interest rates aggressively, propping investor sentiment slightly. The pan-European STOXX Europe 600 Index surged 2.40% in local currency terms. Major stock indexes were mixed, with Italy’s FTSE MIB Index climbing 1.52%, France’s CAC 40 Index up by 3.24%, and Germany’s DAX Index little changed. The UK’s FTSE 100 Index gained 2.74%. Core eurozone government bond yields dipped on news that Purchasing Managers’ Index (PMI) readings were weaker than expected, triggering worries of an economic slowdown. This has caused the market to temper its expectations for policy tightening. Peripheral eurozone government bond yields broadly followed core markets, as well as did UK gilt yields. Fears about the economic outlook were intensified by record UK inflation and a fall in consumer confidence, causing yields to descend. Norway’s central bank raised interest rates by 50 basis points to 1.25%, which was larger than expected.

Japan’s bourses chalked up solid gains for the week. The Nikkei 225 Index rose 2.04% while the broader TOPIX Index climbed 1.68%. Investor sentiment was supported by continuing expectations that the Bank of Japan (BoJ) will keep its monetary policy ultra-loose, even though consumer prices continue to trend upward and the yen descends to fresh lows. The June PMI data indicated that business activity expanded robustly in the services sector, which also provided a boost to sentiment. However, there remained fears that the U.S Federal Reserve will pursue its monetary policy tightening aggressively, leading to global recession, and muting investor appetite. The yield on the 10-year Japanese government bond dipped to 0.23%, slightly below the previous week’s 0.24%. The yen continues to trek near its 24-year low against the U.S. dollar, closing the week at the upper end of the JPY 134 range.

China’s stock markets rose on hopes of a stimulus following a pledge by President Xi Jinping to roll out more measures to support the economy and reduce the impact of COVID-19. The broad, capitalization-weighted Shanghai Composite Index gained 1.0% while the blue-chip CSI 300 Index, which tracks the largest listed companies in Shenzhen and Shanghai, ascended 1.97%. the yuan was relatively stable at CNY 6.69 per U.S. dollar, from CNY 6.70 the preceding week. The yield on the 10-year China government bond slid to 2.81% from 2.83% the week earlier as a result of the People’s Bank of China (PBOC) injecting CNY 60 billion worth of seven-day reverse repos into the financial system. To avoid further divergence in monetary policy from the strict tightening of other global central banks, the PBOC kept its benchmark lending rates unchanged. If Beijing reduces rates to support a slowing economy, it risks the depreciation of the yuan and acceleration of capital outflows.

The Week Ahead

In the coming week, important economic data to be released include personal consumption and expenditures, scheduled at 7:30 a.m. on Thursday.

Key Topics to Watch

  • Durable goods orders
  • Core capital goods orders
  • Pending home sales index
  • Trade in goods (advance)
  • S&P Case-Shiller U.S. home price index (year-over-year)
  • Consumer confidence index
  • Gross domestic product revision (SAAR)
  • Final domestic demand revision (SAAR)
  • Gross domestic income revision (SAAR)
  • PCE inflation (monthly)
  • Core PCE inflation (monthly)
  • PCE inflation (year-over-year)
  • Core PCE inflation (year-over-year)
  • Real disposable income
  • Real consumer spending
  • Nominal personal income
  • Nominal consumer spending
  • Initial jobless claims
  • Continuing jobless claims
  • Chicago PMI
  • S&P Global U.S. manufacturing PMI (final)
  • ISM manufacturing index
  • Construction spending

Markets Index Wrap Up

Weekly Market Review – June 18, 2022

Stock Markets

Stocks ended sharply lower for the second consecutive week on fears that the economy will experience a hard landing due to the Federal Reserve’s most aggressive rate hike since 1994. The week began with a sell-off that left every stock in the S&P 500 down at one point, a phenomenon that has not happened since 1996. Analysts attributed this to continuing inflation worries that were sparked the preceding Friday by a surprise increase in the May consumer inflation data. It was further worsened by a report on Monday by the Wall Street Journal that Fed officials were mulling an increase in interest rates by 75 basis points (or 0.75%) on the coming Wednesday meeting, something the market priced in the week earlier as having only a 2% chance of happening.

The Dow Jones Industrial Average (DJIA) lost 4.79% for the week while the S&P 500 came down by 5.79%. The Nasdaq composite also dropped 5.79%. The NYSE composite fell by 6.62%. Many investors are concerned that a recession is likely if businesses succumb to high-interest rates and a possible credit crunch. The S&P 500 underwent its worst weekly decline since March 2020 and officially entered a bear market as it closed the week almost 24% below its highest level in January. The percentage of S&P 500 stocks that were trading above their 50-day moving average plunged below 5% for the past week. This is the lowest level since the pandemic began in 2020.

U.S. Economy

Headline inflation remains unrelentingly high due to geopolitical shocks to oil and food prices as well as persistent bottlenecks in the supply chain. This has forced the Fed to further accelerate its rate-hiking strategy in an intensified effort to mitigate inflation expectations, increasing the risks of a Federal-induced recession. According to several reports, there is a possibility that Fed tightening and the surge in mortgage rates will have an impact on the housing sector. In May, building permits fell 7% to their lowest limit since September 2021. Housing starts dropped 14.4%, the biggest since the pandemic began. Weekly jobless claims were 229,000, higher than the expected 210,000.

Furthermore, there was a surprise contraction in Mid-Atlantic factory activity, the first since May 2020, mirroring a contraction and weaker-than-expected reading in the New York region that was reported earlier in the week. Overall retail sales fell 0.3% in May due to a sharp decline in auto purchases that reflected, in part, the higher rates on car loans. Even with the exclusion of autos, sales rose only 0.5% which was lower than the consensus expectation of 0.8%. Sales rose only 0.1% excluding gasoline. The data confirms that consumers were buying less in real terms in light of the higher year-over-year increase in consumer inflation (8.6%) than in non-inflation-adjusted retail sales (8.1%). By these indications, fears of an impending recession are materializing.

Metals and Mining

The gold market is expected to absorb a 2% loss for the week, although many investors in precious metals see the price movement as a positive development with gold standing up to the most aggressive Federal Reserve actions in almost three decades. With inflation at a fresh 40-year high last month, the Fed had no option but to raise interest rates by 75 basis points during the week. Simultaneously, the central bank also took further aggressive action since it anticipates that interest rates may potentially increase to 3.5% by the end of 2022 and possibly hit 4.0% in 2023. Markets are pricing in an additional 75 basis point increase next month as Federal Reserve Chair Powell proclaimed that inflation remains the biggest economic threat. Despite these concerns, gold prices maintain their ground just slightly below $1,850 per ounce. This is a psychological support level for investors during the past month. While gold prices ended negative week-on-week, by comparison, they still outperform equities.

Gold closed the week prior at $1,871.60 and ended this week at $1,839.39 per troy ounce, a small contraction of 1.72%.  Silver also fell marginally by 1.01%, from the previous week’s close of $21.89 to last week’s close of $21.67 per troy ounce. Platinum edged from $977.50 one week earlier to $933.98 per troy ounce this week for a drop of 4.45%.  Palladium began the week’s trading at $1,934.12 and ended at $1,818.61 per troy ounce for a 5.97% decline. The 3-mo trading prices of base metals tracked the same direction as precious metals. Copper ended the previous week at $9,615.00 and this week at $8,961.50 per metric tonne, a dive of 6.80%. Zinc began at $3,762.00 and closed the week at $3,523.50 per metric tonne for a price depreciation of 34%. Aluminum fell 9.53% from the earlier week’s close at $2,761.00 to this week’s close at $2,498.00 per metric tonne. Tin lost 15.12% week-on-week, from its previous close at $36,740.00 to this week’s close at $31,184.00 per metric tonne.

Energy and Oil

Due to the adoption of sanctions by the European Union, Russia appears to embark on retaliation by holding back its natural gas exports. There have been large reductions in Russian gas flows to Europe throughout this past week, with Germany, Italy, and France receiving less than half of their usual volumes. The Russian majority state-owned multinational energy company Gazprom blames the sanctions that hinder maintenance, while the European countries perceive the unexpected declines as a sign that the Kremlin is trying to get even for past sanctions by limiting the supply of gas. As a result, it is not only oil and oil products that are trading well above historical averages, but also natural gas. Oil prices fell on Friday morning due to heightened fears of an impending recession. In the U.S., the Biden Administration is looking into possibly capping fuel exports out of the U.S. as gasoline outflows rise to 750,000 barrels per day this year. This matter will likely be raised next week at a meeting between Energy Secretary Granholm and oil refiners. In the meantime, the OPEC+ admits its underproduction of oil, below its target in May by 2,695 barrels per day, and bringing total levels of deal compliance to 256%. Several African producers are stuck in force majeure events and Russian production declined in retaliation for sanctions against it.

Natural Gas

At all major locations this report week (June 8 to June 15, 2022), natural gas spot prices fell. The Henry Hub price dropped from $9.46 per million British thermal units (MMBtu) at the start of the week, to $7.72/MMBtu at the end of the week. International natural gas spot prices were mixed for the week. The weekly average swap prices for liquefied natural gas (LNG) cargoes in East Asia fell $0.68 to a weekly average of $23.09/MMBtu. At the Title Transfer Facility in the Netherlands, Europe’s most liquid natural gas spot market, the day-ahead spot price rose $3.21 to a weekly average of $27.70/MMBtu. Last year, during the same week (ending June 16, 2021), the price in East Asia was $10.92/MMBtu and at the TTF it was $10.01/MMBtu.

In the U.S. market, prices along the Gulf Coast dropped as the Freeport LNG outage was expected to last three months or more. Prices in the Midwest fell with the national average. In the meantime, prices across the West declined with the national average, even as temperatures resulted in increased demand for air conditioning across the Southwest. Prices in the Northeast fell from the high levels of a week ago. U.S. natural gas supply increased week-over-week, as higher net imports from Canada help to meet Midwest demand. U.S. natural gas demand increased as temperatures exceeded normal levels across much of the country. U.S. LNG exports decreased by one vessel this week from last week.

World Markets

European shares fell sharply on worries that economic growth may slow down after several banks announced rate increases. The pan-European STOXX Europe 600 Index ended the week 4.60% lower. Major indexes substantially declined, with France’s CAC 40 Index losing 4.92%, Germany’s DAX Index sliding 4.62%, and Italy’s FTSE MIB Index pulling back by 3.36%. the UK’s FTSE 100 Index lost 4.12% of its value. Fears of another eurozone debt crisis were stoked after a jump in borrowing costs for some heavily indebted member states, prompting an unscheduled meeting of the European Central Bank’s (ECB) Governing Council. After the ad hoc meeting, the ECB released a statement that it would take action to stem the widening yield spread between member states’ sovereign bonds. Such measures would include targeted adjustments in reinvesting the proceeds from maturing debt in the portfolio associated with the central bank’s emergency purchase program. Furthermore, the ECB will seek to develop a new tool to help ease the “fragmentation” in borrowing costs.

In Japan, the stock markets took a sharp dive last week. The Nikkei lost 6.69% and the broader TOPIX index dropped 5.52%. the U.S. Federal Reserve’s announcement of its steepest interest rate hike since 1994 sparked fears of a recession, coincidental with the move by other central banks to curb the surging inflation. The Bank of Japan (BoJ), contrary to the rest of the central banks, maintained its ultralow interest rates, The yield on the 10-year Japanese government bond (JGB) dipped slightly to 0.24% from 0.25% at the end of the week before. It breached the top of the BoJ’s 0.25% policy bank briefly early in the week, causing the central bank to announce an additional, unscheduled outright purchase of JGBs. The yen continued to hover around a 24-year low but it gained some strength over the week, treading at approximately JPY 134.3 against the U.S. dollar, from the earlier week’s JPY 134.4.

Contrary to the rest of the bourses in the West, China’s stock markets advanced with the anticipation that a pickup in fixed asset investments would put the economy back on track. The broad, capitalization-weighted Shanghai Composite Index gained 1.0% and the blue-chip CSI 300 Index, which keeps track of the largest-listed companies in Shanghai and Shenzhen, rose 1.4%, attaining its highest level in three months. The country’s state planner approved 10 fixed asset investments worth CNY 121 billion (USD 18.1 billion) in May, more than six times that of April. The jump in investor sentiment was also impacted by data showing the unexpected growth in May’s industrial production, and from hopes of increased policy support following weak housing market data. Relaxed coronavirus measures in Beijing further improved market sentiment. The yuan remained flat against the U.S. dollar and ended at 6.70 from 6.69 the week before.

The Week Ahead

In the coming week, expect important economic data to be released including the Markit PMI services composite and the Michigan consumer sentiment survey. Several Fed officials are scheduled to speak to give their take on the direction of monetary policy and the economy.

Key Topics to Watch

  • St. Louis Fed President James Bullard speaks
  • Chicago Fed national activity index
  • Existing home sales (SAAR)
  • Cleveland Fed President Loretta Mester speaks
  • Richmond Fed President Tom Barkin speaks
  • Fed Chair Jerome Powell testifies on monetary policy at Senate Banking Committee
  • Chicago Fed President James Bullard speaks
  • Initial jobless claims
  • Continuing jobless claims
  • Current account deficit
  • S&P Global U.S. manufacturing PMI (flash)
  • S&P Global U.S. services PMI (flash)
  • Fed Chair Jerome Powell testifies on monetary policy at House Financial Services Committee
  • St. Louis Fed President James Bullard speaks
  • UMich consumer sentiment index (final)
  • 5-year inflation expectations (final)
  • New home sales (SAAR)
  • San Francisco Fed President Mary Daly speaks

Markets Index Wrap Up

Weekly Market Review – June 11, 2022

Stock Markets

Over the last five days of trading, stocks plunged sharply on further news of rising inflation rates. The Dow Jones Industrial Average (DJIA) dropped 1,506.91 points (4.58%) during the week, a full 880.00 points (2.73%) on Friday alone. The S&P 500 Index lost 207.68 points (5.05%) while the Nasdaq Composite Index pulled back by 672.71 points (5.60%). The NYSE Composite Index plummeted by 700.48 points (4.43%) over the week. The losses occurred from Thursday afternoon to Friday, despite early-week strength in the stock market. The sell-down was triggered by the release of May’s higher-than-expected consumer price index (CPI) data. Trading volumes were light and volatility was relatively low, as measured by the Chicago Board Options Exchange (CBOE) Volatility Index (VIX). Volatility, however, kicked up sharply at the end of the week.

Losses in the Nasdaq Composite, which tracks tech stocks, were worse than that of the broad market as higher interest rates reduce the attraction of companies whose earnings may not be realized until well into the future. Value stocks outperformed growth stocks. Furthermore, oil prices maintained their upward trek for most of the week although they did retrace somewhat on Friday. Major retailers were perceived to continue their struggle caused by mismatches in supply and demand, worsening their inventory problems.

U.S. Economy

The biggest market-moving data for the week was the release on Friday of the U.S. CPI reading for May. The reported year-over-year figure came out at 8.6%, hotter than the expected 8.2%. Core CPI, which excludes food and energy, registered 6.0% which is only slightly above the forecasted 5.9%. Analysts continue to reiterate that a recession is far from inevitable. While headline inflation continued to move substantially higher driven by rising oil and food prices, core inflation appears to be gradually easing.

This month, the widest differential between headline and core inflation has occurred than has been seen in the past ten years. While the Federal Reserve may try to moderate consumer-discretionary demand by raising interest rates, such measures generally do not influence global community prices or the demand for food, energy, and other consumer staples. The Fed remains focused on driving down core inflation, and its attempts appear to be taking effect. There was a modest decline in core inflation his month, from 6.2% to 6.0% year-over-year, in part due to better prices for medical care and transportation services.

As a result, impending higher mortgage rates may cool the housing market, which may, in time, temper the shelter/rent components of CPI. The early signs of layoffs in such areas as the technology sector may likewise begin to cool the upward pressure exerted by wage growth on inflation. Overall, it is foreseeable for inflation to moderate some time by the end of 2022, according to analysts’ base-case scenario – that is, driven by base effects evident as more favorable year-on-year comparisons, and better trends in core inflation. In the near term, however, the rising food and energy prices may still create a bear-case scenario for the economy.

Metals and Mining

The gold market came to life on Friday after a relatively quiet week. Investors reacted to the hotter-than-expected inflation announcement at the week’s end, despite economists’ expectations of a continued decline in consumer prices in May. Instead, the U.S. Labor Department announced that its CPI reading rose 8.6% for the month, establishing a new 40-year high. Analysts have begun to call into question the Federal Reserve’s credibility as investors became doubtful that the central bank can bring inflation down. Gold prices performed impressively on Friday, swinging $50 from the bottom of its range only slightly above $1,825 per ounce to test its significant resistance at $1,875 per ounce.

Gold gained 1.10% from its earlier week’s close at $1,851.19 to this Friday’s close at $1,871.60 per troy ounce. Silver, which ended the previous week at $21.93, closed this week at $21.89 per troy ounce, slightly lower by 0.18%. Platinum dipped 3.95% from its previous close at $1,017.73 to last Friday’s close at $977.50 per troy ounce. Palladium likewise shaved off 2.45% from its prior close at $1,982.74 to this week’s close at $1,934.12 per troy ounce. The 3-Mo base metal prices remained mostly unchanged. Copper rose 1.22% from the previous week’s close at $9,499.50 to this week’s close at $9,615.00 per metric tonne. Zinc, which ended one week ago at $3,864.50, closed this week at $3,762.00 per metric tonne, lower by 2.65%. Aluminum, which closed the prior week at $2,726.00, ended this week at $2,761.00 per metric tonne, gaining 1.28%. Tin began at $34,929.00 and ended at $36,740.00 per metric tonne, for a weekly gain of 5.18%

Energy and Oil

Just at a time when prospects appeared to improve with the gradual disappearance of COVID-19, the reimposition of lockdown restrictions in Shanghai and Beijing continued to apply pressure to the oil markets in the form of pandemic-related demand losses. China’s failure to quickly bound back from the coronavirus was the main diver for the downward force on oil prices in the past months. When it anticipated a quick return to normal levels in economic activity over June, China loaded up on oil and oil products in May, which now, in hindsight, may lead to lower imports. The failure of China’s expected demand surge to materialize is now weighing down oil prices, giving back the gains made earlier in the week and causing ICE Brent to fall back to $120 per barrel on Friday. In the meantime, anti-oil rhetoric from White House officials lambasted oil and gas companies for failing to subdue rising fuel prices. Officials admit, however, that the windfall tax is an option on the table, with U.S. firms expecting to generate $834 billion in free cash flow for 2022.

Natural Gas

For the report week from June 1 to June 8, 2022, natural gas spot prices rose at most locations. The Henry Hub spot price climbed from $8.42 per million British thermal units (MMBtu) at the beginning of the week to $9.46/MMBtu by the week’s end. These are the highest daily prices since February 2021, when a winter storm contributed to near record-high spot prices. International natural gas spot prices were mixed during the report week. The average weekly swap prices for liquefied natural gas (LNG) cargoes in East Asia remained unchanged week-over-week at $23.77/MMBtu. In the Netherlands, where the Title Transfer Facility remains the most liquid natural gas spot price in Europe, the day-ahead price fell $2.02/MMBtu to a weekly average of $24.49/MMBtu. Comparing this week’s prices to their counterparts last year, for the week ended June 9, 2021, the price in East Asia was $10.65/MMBtu while that at TTF was $9.58/MMBtu.

In the United States, prices along the Gulf Coast rose as higher temperatures resulted in increased demand for air conditioning. Across the West, prices rose as temperatures increased in California and the Desert Southwest. Prices were mixed in the Northeast due to differing fundamentals. U.S. natural gas supply remained unchanged week-over-week at 100.8 billion cubic feet per day (Bcf/d) while natural gas demand increased due to rising temperatures across the country. U.S. LNG exports decreased by one vessel this week compared to last week.

World Markets

European shares took a sharp dive upon the announcement by the European Central Bank (ECB) that it may increase interest rates faster than expected after July when it ends its ultra-accommodative monetary policy. The ECB signaled that it is planning to raise its key deposit rate, which currently remains at -0.5%, by a quarter-point in July to control the record inflation.  The bank also suggested that if the medium-term inflation outlook deteriorates further, a larger increase may be decided upon at the September meeting. The pan-European STOXX Europe 600 Index closed the week lower by 3.95% in local currency terms, and Italy’s FTSE MIB Index dropped 6.70% amid concerns that the country may not be able to manage its national debt load without central bank support. Germany’s DAX Index gave up 4.83% while France’s CAC 40 Index also slumped by 4.60%. The core eurozone bond yields jumped, mainly in reaction to the ECB policy meeting which investors perceived to be more hawkish than expected. Peripheral eurozone and UK government bond yields broadly followed the core markets.

Japan’s stock markets, on the other hand, registered moderate gains for this week. The Nikkei 225 Index rose 0.23% while the broader TOPIX Index move up 0.51%. The positive sentiment may be attributed to Cabinet Office data indicating Japan’s economy shrunk by an annualized 0.5% over the first quarter of 2022, lower than the expected 1.0% contraction. The better-than-anticipated economic performance was seen to be the result of the country’s reopening tourism industry. In the fixed income markets, the yield on the 10-year Japanese government bond rose to 0.25% from 0.23% at the end of the previous week. The yen continued to remain weak, providing a boost to Japanese exporters. The currency ended the week at approximately JPY 133.9 against the U.S. dollar, from the earlier week’s JPY 130.8. The exchange rate continues to remain close to its two-decade lows. The further weakening of the yen has senior officials from the Bank of Japan (BoJ) expressing their concerns. BoJ Governor Haruhiko Kuroda said that since Japan’s economy has not yet recovered to its pre-pandemic levels, the bank must continue to extend its support for economic activity by continuing with its current monetary easing.

In China, stock markets rallied on the hope of looser monetary policy and perceived signals from Beijing that it was easing its years-long crackdown on technology companies. The broad capitalization-weighted Shanghai Composite Index gained 2.7% while the blue-chip CSI 300 Index, which follows the largest-listed companies in Shanghai and Shenzhen, surged 3.7%, its biggest weekly gain since February 2021. Regulators are closing down their investigation into DiDi Global, the ride-hailing mobile app, and will restore it in domestic app stores. Authorities are reportedly in talks concerning the revival of the initial public offering for fintech company Ant Group which was halted in December 2020 after its founder, Jack Ma, made critical comments regarding China’s financial regulators. These two developments are perceived as a sign that Beijing is easing its regulatory clampdown on the tech sector that began at the end of 2020. A further indication of the government’s policy relaxation is the granting of publishing licenses by the country’s gaming regulator to 60 online games. This is the biggest approval of titles for computers and smartphones going back to July 2021. The yield on China’s 10-year government bond ended the week at 2.82%, roughly unchanged from a week ago.

The Week Ahead

Among the important economic data expected to be released in the coming week are the Fed fund target interest rate, business inventories, and producer price data.

Key Topics to Watch

  • NY Fed 1-year inflation expectations
  • NY Fed 3-year inflation expectations
  • NFIB small-business index
  • Producer price index final demand
  • Retail sales
  • Retail sales excluding vehicles
  • Import price index
  • Empire state manufacturing index
  • NAHB home builders index
  • Business inventories
  • FOMC statement
  • FOMC projections
  • Fed Chair Jerome Powell news conference
  • Initial jobless claims
  • Continuing jobless claims
  • Building permits (SAAR)
  • Housing starts (SAAR)
  • Philadelphia Fed manufacturing index
  • Industrial production index
  • Capacity utilization
  • Leading economic indicators

Markets Index Wrap Up

Weekly Market Review – June 4, 2022

Stock Markets

Part of the previous week’s strong gains was given up during this week’s trading, despite being only a four-day trade week due to Monday being Memorial Day. Investors continue to remain uncertain as to whether the Federal Reserve will be able to rein in inflation without pushing the economy into a full-blown recession. The industrial sector outperformed the rest of the market-driven by a rise in Boeing. Furthermore, gains in Amazon shares boosted consumer discretionary shares which also proved resilient. Volatility proceeded moderately as expected, although analysts expect the economy to become progressively destabilized by the rising interest rates and elevated commodity prices. On Friday, Elon Musk emailed his fellow executives that 10% of Tesla’s workforce may be laid off and that he had a “super bad feeling” about the global economy.

U.S. Economy

The economic news released during the week did not particularly signal that the economy would be headed towards a worsening employment situation marked by layoffs. A report issued by the Labor Department last Friday indicated that employers added 390,000 nonfarm jobs in May, exceeding consensus expectations of 320,000. Weekly jobless claims reported on Thursday were slightly lower than expected, even as April job openings registered 11.4 million, only slightly below record highs. The unemployment rate holds steady at 3.6%, the best rate since the pandemic began and just marginally above the lowest rate for the last half-century. That being said, the Conference Board’s index of consumer confidence slid lower in May, reflecting the lessening enthusiasm workers felt about their job prospects. Modestly more Americans said that jobs were “hard to get.”

While the economy appears to be slowing due to ongoing inflation, rising consumer prices, supply-chain bottlenecks, and tightening financial conditions, it is far teetering on the edges of a recession. The wage situation, in line with the jobs market and employment rate, shows that average hourly earnings were up 5.2% over the year before, suggesting that: (1) wage growth remains sufficiently robust and is expected to support household income and spending, which in turn will drive further economic expansion, and (2) wage growth will continue to support ongoing inflation, which the Fed is expected to meet with additional rate hikes. While the labor market situation is not exactly sounding the alarm, it appears that there is little room for further improvement from this point onwards. Economic and corporate-earnings growth may continue and market fundamentals still provide some impetus for gains, but until there is greater confidence in the market the prospects are still uncertain about a durable rebound in the near future.

Metals and Mining

The price of gold treaded a sideways path this week as prices varied little beyond the $1,850 per ounce range. There appears to be a swell building, however, as physical demand saw an extraordinary rise in May. According to the U.S. Mint, it sold 147,000 ounces of gold, its best May performance going back to 2010. Gold bullion is up 400% from its five-year average between 2015 and 2019, thus the sudden demand does not appear attributable to any covid-19 market disruptions. Analysts have also noted that there is a delinking between the physical demand and the paper market for gold. There is a distortion created by the capping of gold futures prices as a result of rising bond yields and the stronger U.S. dollar caused by the Federal Reserve’s aggressively raising interest rates. A better picture of investor sentiment and anxiety in the precious metals market is reflected in the physical gold market.

The spot price for gold rose from $1,853.72 to $1,851.19 per troy ounce during this trading week, a slight loss of 0.14%. Silver slid 0.81% down from the previous week’s $22.11 to this week’s close of $21.93 per troy ounce. Platinum rose from $958.13 to $1,017.73 per troy ounce for a week-on-week gain of 6.22%. Palladium dipped from the prior week’s ending price of $2,067.44 to this week’s close at $1,982.74 per troy ounce, a loss of 4.10%. The 3-mo prices of base metals likewise exhibited listless trading. Copper began at $9,459.00 and ended at $9,499.50 per metric tonne, inching upward by 0.43%. Zinc closed the previous week at $3,843.50 and closed this week at $3,864.50 per metric tonne for a gain of 0.55%. Aluminum lost 5.07% from the earlier week’s close at $2,871.50 to this week’s close at $2,726.00 per metric tonne. Tin gained 2.41% from the prior week’s price at $34,106.00 to this week’s ending price at $34,929.00 per metric tonne.

Energy and Oil

The oil markets went through a roller coaster ride this week as turmoil governed the major suppliers of fossil fuels. China is emerging from its three-month pandemic lockdown, creating a scenario for dramatically increasing demand. Reports also revealed that Saudi Arabia and the UAE are poised to accelerate the monthly increments of OPEC+. The oil group opted for 648,000 barred-per-day increases in July and August to bring the final unwinding of its production cuts forward by one month on fears that Russian production may be falling. The move sent hopes up that prices may indeed be on their way down closer to $110 per barrel.

Unfortunately for those looking forward to lower prices, the news was released that U.S. inventories were dropping at the same time the European Union (EU) decided to ban Russian oil imports. This arrested the downtrend and sent oil prices climbing once more. The EU finalized its prohibition of financing and financial assistance services for Russian oil cargoes after a wind-down period of six months. The measure effectively bans EU member states from providing insurance to Russian trade.

Natural Gas

The spot prices of natural gas fell at most locations during the report week May 25 to June 1. The Henry Hub spot prices dipped from $9.30 per million British thermal units (MMBtu) to $8.42/MMBtu week-on-week. On the other hand, international natural gas spot prices rose or the week. Liquefied natural gas (LNG) cargoes in East Asia ascended by $1.89/MMBtu to bring the weekly average of LNG prices to $23.77/MMBtu. In the Netherlands, at the Title Transfer Facility (TTF) which is Europe’s most liquid natural gas spot market, the day-ahead price increased by $0.59 to a weekly average of $26.51/MMBtu. By comparison, last year’s corresponding average prices for the week ending June 2, 2021, in East Asia and the TTF were $10.54/MMBtu and $9.12/MMBtu, respectively.

In the domestic market, prices along the Gulf coast fell as temperatures remained close to normal, consumption fell in all sectors, and LNG exports decreased. In the Midwest, prices decreased as temperatures increased and demand for natural gas declined. Prices across the Midwest fell in line with the national average, while Northeast prices decreased due to mild weather on average, resulting in lower consumption. U.S. natural gas supply increased week over week, while demand fell as temperatures moderated toward normal. This week from last week, U.S. LNG exports decreased by one vessel.

World Markets

Decline and thin volume marked trading in the European stock market during the week that the UK celebrated the platinum anniversary of Queen Elizabeth II’s ascendancy to the throne. Investors were reticent due to elevated inflation, the prospects of an economic slowdown, continued restrictive policies and monetary tightening by the central banks, and the ongoing war in Ukraine. The pan-European STOXX Europe 600 Index closed the week down by 0.87%. Major indexes were weaker across the board. Italy’s FTSE MIB fell by 1.91%, France’s CAC 40 lost 0.47%, and Germany’s Xetra DAX Index moved sideways. The UK’s FTSE 100 Index dipped by 0.69% through Wednesday, on shortened trading for the week due to the holiday celebrations. Eurozone inflation soars to a record high of 8.1% in May, with commodity prices accelerating in the 19 member states at a rate faster than expected. Several policymakers now agree that rates need to be raised to curb inflation although they disagree on the pace of tightening, with some calling for a 50-basis point increase in July. The European Central Bank has maintained a negative deposit rate since 2014, which is now at -0.5%.

Japan’s stock markets recorded a gain for the week, with the Nikkei 225 rising 3.66% and the broader TOPIX Index climbing 2.43%. Continued relaxation of Japan’s strict border controls and the decision by Chinese authorities to allow segments of the economy to reopen after the coronavirus lockdown restrictions helped boost investor sentiment. After a two-year ban on foreign tourism due to the coronavirus epidemic, Japan has adopted further measures toward a wider reopening of its borders. The yield on the 10-year Japanese government bond ended the week unchanged at 0.23%, as the yen weakened to approximately JPY 129.88 per U.S. dollar, from JPY 127.10 at the end of the preceding week. Japan has also reiterated its commitment to monetary easing.

In China, stocks rallied during the holiday-shortened week in response to Beijing’s unveiling of support measures to cushion an impending economic slowdown. The slowdown was the anticipated result of the country’s zero-tolerance approach to the Covid-19 spread. During the trading week that ended Thursday, the broad, capitalization-weighted Shanghai Composite Index rose by approximately 2.1%, and the blue-chip CSI 300 Index, which tracks the largest listed companies in Shanghai and Shenzhen, gained 2.2%. Trading was closed on Friday in celebration of the Dragon Boat Festival. The government unveiled an additional 33 measures of its stimulus programs which it announced the previous week, covering fiscal, financial, investment, and industrial policies.

The Week Ahead

Among the important economic data to be released this week are the foreign trade balance, consumer price index, and hourly earnings growth.

Key Topics to Watch

  • Foreign trade balance
  • Consumer credit
  • Wholesale inventories revision
  • Initial jobless claims
  • Continuing jobless claims
  • Real household net worth (SAAR)
  • Real domestic nonfinancial debt (SAAR)
  • Consumer price index (monthly)
  • Core CPI (monthly)
  • CPI (year-over-year)
  • Core CPI (year-over-year)
  • UMich consumer sentiment index (preliminary)
  • 5-year inflation expectations (preliminary)
  • Federal budget balance

Markets Index Wrap Up

Weekly Market Review – May 28, 2022

Stock Markets

Stock markets gained ground this week after seven straight weeks of losses. Every sector of the large-cap S&P 500 advanced, led by consumer discretionary and energy stocks which surged the most. Underperforming the rest was the health care sector. Even the tech-heavy Nasdaq Composite Index exhibited solid gains. The cross-sector strength seems to have materialized from the positive perception that the hitherto rising inflation may have already reached its peak. Several developments provided an impetus for the S&P 500 to rally from its lowest level in more than a year. These include selling exhaustion, positive retail earnings reports, and signs of flexibility in the Fed policy. The result is that the S&P 500 has successfully averted a plunge into bear territory that was widely anticipated last week when it descended 20% from its peak, a technical bear indication. Bond returns have improved, with fixed-income investments becoming more attractive and investors pricing in slower economic growth into the future.

U.S. Economy

The most recent economic and earnings reports appear to send mixed signals which, in turn, challenge the prevailing sentiment that a recession is imminent. Economic growth is still positive although slowing down, and several signals still point to the possibility of continued expansion. Although inflation is still of major concern, consumer spending remains robust and overall demand is resilient. Missed target earnings among some retailers were mostly due to rising costs rather than weakened consumer spending. Consumption increased in April at the fastest rate in three months when adjusted for inflation. This is further buoyed by stable job growth and accumulated savings.

Regarding the Fed’s tightening policy that many fear will cause a recession, the policymakers appear to be more flexible than originally thought after the possible large rate hikes in June and July. Moreover, high inflation, which is feared to be sustained for the rest of the year, appears to be slowing down. Even as the 40-year-high inflation rate keeps the Fed on the lookout for runaway increases in consumer prices, the annual rate of price increases appears to have peaked between March and April, Inflation expectations derived from the bond market have noticeably dropped over the past month. Inflation will likely maintain a path of gradual moderation until the end of 2022 as the rise in borrowing costs slows the housing market, demand for goods eases, and supply concerns are resolved.

Metals and Mining

Prices of precious metals are still impacted by inflationary pressures, but on Friday, good news from the U.S. Department of Commerce alleviated some of the market jitters. The agency announced that the Federal Reserve’s preferred measure of inflation, the core Personal Consumption Expenditures Index, rose 4.9% on an annual basis for the month of April. This is down from 5.2% seen last March. This is an indication that inflation has dropped for the last two months from its peak of 5.3% last February. The prospect of a recession is growing more distant and the economy appears poised for continued expansion, although at a slower pace. Gold will continue to face challenging headwinds due to rising interest rates that tend to draw investor attention away from non-yielding assets like gold. Nevertheless, because of the continuing threat of inflation, the role of gold as a safe-haven asset and a hedge against inflation continues to remain highly relevant in portfolio composition.

Gold moved sideways this week, gaining a modest 0.39% from the previous week’s close at $1,846.50 to end this week at $1,853.72 per troy ounce. Silver added 1.52% to its value, rising from $21.78 the week before to this week’s $22.11 per troy ounce.  Platinum also inched up slightly from $957.17 the week earlier to this week’s $958.13 per troy ounce, an appreciation of 0.10%. Palladium began at $1,964.92 and closed the week at $2,067.44 per troy ounce, for a gain of 5.22%. The three-month prices for base metals also went through listless trading for the week. Copper, which ended at $9,422.00 one week earlier, closed this week at $9,459.00 per metric tonne for a gain of 39%. Zinc added on 3.68% from its week-ago price of $3,707.00 to this week’s close at $3,843.50 per metric tonne. Aluminum lost marginally by 2.53% from last week’s $2,946.00 to this week’s $2,871.50 per metric tonne. Tin also lost by 1.61% from its week-ago close at $34,665.00 to this week’s close at $34,106.00 per metric tonne.

Energy and Oil

Oil prices inched higher in light of the improving demand signals due to the further easing of pandemic lockdowns and restrictions. The lack of supply options in the global oil market has been further underscored, however, particularly if there materializes a drastic squeeze in Russian oil production. The European Union is feared to be approaching an outright ban on the importation of Russian oil, a step which it appears to be reluctant to take but does not rule out. The EU may reach a deal on Russian oil sanctions in the coming week’s leader summit scheduled for May 30-31.

U.S. gasoline and crude inventories are continuing in their decline; also, the possibility of a JCPOA breakthrough becomes more remote as the United States and Iran move further apart due to recent altercations between them. The antagonism between the two countries was further heightened when U.S. authorities seized two laden oil tankers in the Mediterranean, anchored in the territorial waters of Croatia and Greece. The cargoes allegedly consisted of smuggled oil for Iran’s Revolutionary Guard Corps. Analysts are not eliminating the possibility of another surge in oil prices to the $130-140 per barrel range this summer.

Natural Gas

Spot prices of natural gas increased at most locations this report week, May 18 to May 25. The Henry Hub spot price ascended to $9.30 per million British thermal units (MMBtu) from $8.45/MMBtu throughout the week. International natural gas spot prices took the opposite direction for the week, as the swap prices for liquefied natural gas (LNG) descended by $1.64/MMBtu to a weekly average of $21.88/MMBtu in East Asia. At the Title Transfer Facility (TTF) in the Netherlands, the day-ahead price fell by $2,20/MMBtu to a weekly average of $25.92/MMBtu. By comparison, the corresponding prices in East Asia and the TTF were $10.05/MMBtu and $9.04/MMBtu, respectively, for the same week last year (week ending May 26, 2021).

Domestic prices for natural gas along the Gulf Coast rose as demand growth in the Southeast and Texas outpaces supply growth. In the Midwest, prices increased with the national average as temperatures fluctuated. Prices across the West rose as the natural gas share of electricity generation increased in California. In the Northeast, natural gas prices increased as consumption increased across all sectors. U.S. natural gas supply decreased slightly week over week. Natural gas demand in the country rose slightly with mixed temperatures. The U.S. LNG exports increased by five vessels this past week compared to the week before.

World Markets

In Europe, equities took a break from inflation fears as shares rose and confidence returned. Investors’ sentiments took into account that inflation may be reaching its peak and that central banks will embark on a more gradual interest rate increase. Due to the holidays, market volumes were light, and the rebound may seek confirmation in the coming week’s resumption of trading. The pan-European STOXX Europe 600 Index closed the week higher by 2.98% over last week. The main market indexes likewise gained, with Italy’s FTSE MIB Index rising 2.25%, Germany’s DAX Index climbing 3.44%, and France’s CAC 40 Index advancing 3.67%. The UK’s FTSE 100 Index surged 2.65%. The core eurozone bonds were volatile but ended higher. After European Central Bank (ECB) President Christine Lagarde signaled the possibility of positive rates by the year’s end, yields moved up briefly. They retreated somewhat, however, upon the release of weaker-than-expected eurozone PMI data. Peripheral eurozone bonds yields fell while UK gilt yields broadly tracked core markets.

The Japanese stock markets began the week on a positive note but quickly turned southwards with three consecutive session losses. The market quickly reversed again by late Friday trading, however, making up for the losses but even ending higher to register week-on-week gains. The Nikkei 225 ended with a 0.16% gain in local currency terms, and the broader TOPIX registered 0.53% higher for the week. The late rally was sparked by Japanese equities taking their cue from Wall Street, which itself closed sharply higher overnight. As the Nikkei 225 neared the 27,000 resistance level, however, investors took profits and ultimately capped market gains. The yield on the 10-year Japanese government bond dipped as the yen strengthened against the U.S. dollar.

In China, the markets dipped on concerns that the economy is slowing down, weighed by the country’s zero-tolerance approach to fighting the coronavirus. The broad Shanghai Composite Index pulled back 0.5% while the blue-chip CSI 300 Index, which keeps track of the largest-listed companies in Shanghai and Shenzhen, lost 1.9%. Information released revealed that profits at China’s industrial firms receded at their fastest rate in two years in April, causing investor sentiment to wane. The yield on China’s 10-year government bond fell marginally to 2.756% from the previous week’s 2.836% due to expectations of policy support. The yuan weakened against the dollar, from CNY 6.68 per USD the week earlier to CNY 6.71 per USD this week. The trade-weighted currency descended below 100 for the first time in seven months. This is a reflection of expectations for further capital outflows from China since the Fed’s mounting interest rate increases in the U.S. has diminished the relative attractiveness of China’s assets to investors.

The Week Ahead

Productivity, unit labor costs, and unemployment figures are among the important economic data to be released this week.

Key Topics to Watch

  • S&P Case-Shiller national home price index (year-over-year)
  • FHFA national home price index (year-over-year)
  • Chicago PMI
  • Consumer confidence index
  • S&P Global U.S. manufacturing PMI (final)
  • ISM manufacturing index
  • Job openings
  • Quits
  • Construction spending
  • Beige book
  • Motor vehicle sales (SAAR)
  • ADP employment report
  • Initial jobless claims
  • Continuing jobless claims
  • Productivity revision (SAAR)
  • Unit labor costs revision (SAAR)
  • Factory orders
  • Core capital goods orders revision
  • Nonfarm payrolls
  • Unemployment rate
  • Average hourly earnings
  • Labor force participation, ages 25-54
  • S&P Global U.S. services PMI (final)
  • ISM services index

Markets Index Wrap Up

Weekly Market Review – May 21, 2022

Stock Markets

U.S. stock markets are now down for the seventh consecutive week. On Wednesday, equities saw the biggest one-day decline in the history of the S&P 500 index since June 2020. The S&P 500 fell 20.9% from its intraday high last January. Thereby exceeded the technical 20% pullback indicative of a bear market, but barely recovered to close the week down approximately 18% year-to-date. Despite the sell-down, trading was remarkably subdued with volumes more than 10% below recent 20-day averages as well as below every day of the preceding week. The cause for the continued downward pressure was disappointing earnings and revenue results from many of the country’s major retailers which contributed to the broader market pessimism. Most notable was the 25% loss in Target shares after the announcement that the company’s earnings missed estimates by almost a third. The company attributed its underperformance to a combination of reduced sales of discretionary items such as televisions, and higher costs. Also falling short of expectations were earnings results from Lowe’s, Walmart, and Home Depot. Costco shares also suffered a sell-off partly due to rumors that it was increasing the price of its popular café hot dog. Investors also appeared to be concerned that major retailers may be compelled to pass on to their consumers more of their higher input costs in the coming months, maintaining inflation at elevated levels.

U.S. Economy

Although the markets appear to have priced in about a 75% chance that a recession will take place, this does not appear to be a base-case scenario over the next 12 months. Solid economic fundamentals continue to underlie this economy, particularly healthy consumer appetite, a tight labor market with low unemployment, rising wages, and continued corporate earnings growth although the latter will likely remain in the mid-single digits. April retail sales figures released during the past week exceeded expectations, together with industrial production that also expanded at a monthly rate of 1.1%, well above the forecasted 0.4%.

Analysts point to the likelihood that the current pullback is a non-recessionary market correction. Recovery may take some time, however, because of the continuing elevated inflation and increasingly restrictive policies being adopted by the Federal Reserve. On Wednesday, Fed Chair Jerome Powell remarked in an interview that policy formulators will not hesitate to raise rates as much as necessary due to the “unconditional need” to tame inflation, even if it may be viewed as painful by some market players.

Economic data released this past week provided mixed signals concerning an imminent recession, On Tuesday, investors viewed with optimism the news that retail sales, excluding auto sales, rose more than expected in April (0.6% against 0,4%), and March’s gain was revised upward to 2.1%. Also surprisingly exceeding expectations are reports for industrial production, manufacturing production, and capacity utilization.

Metals and Mining

The Federal Reserve is walking a tightrope between ensuring economic growth and controlling inflation. Despite the nervousness among investors, the gold market continues to hold steady in a volatile market. Reports indicate that investors are fleeing equities, as may be seen in the deep dives of stock prices in the past week. In contrast, the gold market is maintaining a neutral stance for the year so far, making it the outperforming asset to date. Federal Reserve Chair Powell points to rocky weeks ahead as he expressed his commitment to bringing inflation down to the extent of adopting more aggressive measures such as increasing interest rates. In light of current developments, the strong U.S. dollar poses greater challenges for the gold market. This past week, however, the price of gold bounced below $1,800 per ounce, indicating that this level provides strong support for the precious metal and that it is again perceived by investors as a safe-haven asset.

Precious metals spot prices strengthened this week with modest gains. Gold prices moved from last week’s close of $1,811.79 to this week’s $1,846.50 per ounce, a gain of 1.92%. Silver, which previously ended at $21.11, landed at this week’s close of $21.78 per ounce, an increase of 3.17%.  Platinum also gained, this time by 1.15% from the previous week’s close of $946.30 to this week’s $957.17 per ounce. Palladium rose slightly by 0.96% from the preceding week’s $1,946.30 to the recent close at $1,964.92 per ounce. The 3-month base metal prices also followed precious metals. Copper moved from $9,159.00 to $9,422.00 per metric tonne, an increase of 2.87%. Zinc moved within the week from $3,489.50 to its close at $3,707.00 per metric tonne for a 6.23% appreciation. Aluminum went up from the preceding week’s $2,788.00 close to last week’s $2,946.00 per metric tonne for a 5.67% gain. Tin ascended by 3.88% from $33,370.00 the week before to the recent week’s close at $34,665.00 per metric tonne.

Energy and Oil

During the past weeks, India had been the strongest purchaser of Russian crude oil whose continued transactions gave the markets some reason to believe that Russia may comprehensively pivot towards Asia. This past week, however, China emerged as the country which may give Russia a stronger foothold in the Asian market. Beijing launched direct government-to-government talks concerning the purchase of discounted crude to replenish its strategic stocks. Despite the prospect of an impending Chinese reopening, this news added some downward pressure to oil prices as ICE Brent moved around $112 per barrel by Friday. Concurrently, the European Union launched its $220 billion plan to terminate its reliance on Russian fossil fuels by 2027. The plan calls for investing $120 billion in new renewable energy projects, $30 billion in power grids, and $59 billion in energy savings and heating pumps. In the meantime, the United Nations Secretary-General Antonio Guterres called for all governments to end fossil fuel subsidies, which have risen to $500 billion worldwide. The move was intended to exert pressure on polluting nations ahead of the COP27 climate conference in Egypt that is slated for November of this year.

Natural Gas

This report week, May 11 to May 18, natural gas spot prices rose at most locations. The Henry Hub spot price ascended to $8.45 per million British thermal units (MMBtu) from $7.51/MMBtu. This is the highest daily price since a winter storm accounts for the close to record-high spot prices last seen in February 2021. International spot prices were mixed as LNG cargoes in Asia fell by $0.11/MMBtu to an average of $23.51/MMBtu for the week. At the Title Transfer Facility (TTF) in the Netherlands, the most liquid natural gas spot market in Europe, the day-ahead price rose by $0.10/MMBtu to average at $28.11/MMBtu for the week. By comparison, in the same week last year, the average prices in the TTF and in East Asia were $9.17/MMBtu and $9.48/MMBtu, respectively.

Along the Gulf Coast, prices rose as temperatures remained warmer than normal. Prices in the Midwest increased with the national average as temperatures also rose above normal. As temperature remained moderate, prices across the West followed major hub prices higher. In the Northeast, warmer temperatures moved into the region and cooling demand increased, nudging prices higher. The U.S. natural gas supply decreased slightly week over week, and U.S. natural gas demand fell as temperatures rose across many major metropolitan areas. This week from last week, U.S. LNG exports decreased by two vessels.

World Markets

Amid growing concerns of slowing economic growth and accelerated interest rate increases, shares in Europe pulled back for the week. The pan-European STOXX Europe 600 Index dipped 0.55% in local currency terms. France’s CAC 40 Index gave up 1.22% while Germany’s Xetra DAX slid 0.33%. Italy’s FTSE MIB Index bucked the trend and advance modestly. UK’s FTSE 100 Index absorbed a loss of 0.24%. Core eurozone government bond yields were volatile, ending roughly sideways. Several officials of the European Central Bank (ECB) made some hawkish pronouncements, such as the possibility of a 50-basis point interest rate hike in July, that caused yields to rise early in the week. Subsequently, yields pulled back in light of the weak retail earnings in the U.S. that intensified concerns of an economic slowdown. Peripheral eurozone yields broadly tracked core markets over the week and ended slightly higher. UK gilt yields ascended on the prospect of inflation reaching its highest level in four decades, better-than-expected employment data, and hawkish pronouncements from the Bank of England economist Huw Pill.

Japan’s stock market realized positive returns for the week. The Nikkei 225 Index gained 1.18% while the broader TOPIX Index rose 0.71%. Positive regional sentiment due to China’s action to support its property sector gave investors some buying motivation in the latest of a series of monetary easing measures intended to boost the coronavirus-locked down economy. Also providing some support was the announcement by Japan’s government that its strict border control measures would be further eased. In light of these developments, the yield on the 10-year Japanese government bond descended to 0.23% from the previous week’s 0.24%. The yen gained ground against the U.S. dollar to JPY 127.98 from JPY 129.27 one week earlier. Japan’s economy contracted in the first quarter and consumer price inflation exceeded the Bank of Japan’s 2% target in April.

Chinese stocks climbed higher in response to the interest rate cut announced by the central bank in support of its property sector. The slight gain in equities was welcome despite negative economic data weighing on investors’ sentiment. The broad, capitalization-weighted Shanghai Composite Index gained 2.0% while the blue-chip CSI 300 Index which tracks the largest listed companies in Shanghai and Shenzhen also gained 2.2%. Earlier, the People’s Bank of China (PBOC) reduced the five-year loan prime rate (LPR) by a significantly sizeable 15 basis points to 4.45%. The rate cut followed the move by the PBOC to cut the lower limit of mortgage rates for first-time homebuyers. The rate cuts were a response by the central bank to data indicating that home sales in April plunged. The reduction in the five-year LPR sends the signal that the government seeks to encourage homebuying demand. In the meantime, economic data released during the week points to slowing growth amid pandemic lockdowns. The yield on China’s 10-year government bond moved higher to 2.836% from 2.834% a week earlier. The yuan firmed to 6.68 from 6.80 per U.S. dollar.  

The Week Ahead

Economic data expected in the week ahead include the PMI composite, consumer expenditures, and real gross domestic income.

Key Topics to Watch

  • S&P Global U.S. manufacturing PMI (flash)
  • S&P Global U.S. services PMI (flash)
  • New home sales (SAAR)
  • Durable goods orders
  • Core capital equipment orders
  • FOMC minutes
  • Initial jobless claims
  • Continuing jobless claims
  • Real gross domestic product revision (SAAR)
  • Real final sales to domestic purchasers revision (SAAR)
  • Real gross domestic income (SAAR)
  • Pending home sales index
  • PCE inflation
  • Core PCE inflation
  • PCE inflation (year-over-year)
  • Core PCE inflation (year-over-year)
  • Real disposable income
  • Real consumer spending
  • Nominal personal income
  • Nominal consumer spending
  • Advance trade in goods
  • UMich consumer sentiment index (final)
  • 5-year inflation expectations (final)

Markets Index Wrap Up

error: Content is protected !!