
Weekly Market Review – April 17, 2021
Stock Markets
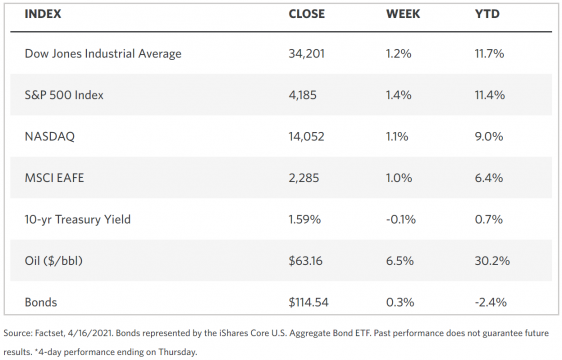
The markets have completed their fourth consecutive week of gains and have now moved to challenge their record peaks. The large and mid-cap benchmarks surged ahead while the technology-based Nasdaq Composite Index and small-cap Russell 2000 Index lagged slightly, although they stayed close to their highs of the past trading weeks. Within the broad S&P 500 Index, the health care sector performed strongly, followed by insurance stocks; in the mining sector, the rising gold and copper prices boosted the performance of company shares. On the other hand, energy shares retreated late in the week but eventually ended flat.
The start of earnings season was behind the positive market sentiment, as 22 companies listed in the S&P 500 were scheduled to release their first-quarter results. Wednesday saw the release of first-quarter earnings reports by the major banks Wells Fargo, JP Morgan, and Goldman Sachs. The positive sentiment also appears to be pushed by the announcement by Pfizer that it could deliver 10% more vaccines by the end of next month, as well as more encouraging news from Moderna.
U.S. Economy
Positive economic news provided the markets with incentives to move further northward. The retail sales for March reported on Thursday achieved a growth rate of 9.8%, the fastest the indicator has grown since May of last year. The gains were generated over a wide range of economic activity, reflecting the accelerated reopening of retail stores and restaurants. It also included recovery from the 2.7% February pullback due to the unexpected extraordinarily cold weather.
- Manufacturing data released during the week was also better than expected by most investors, including news of mid-Atlantic factory activity reported at its highest level in almost 50 years. Regarding unemployment figures, the weekly jobless claims stood at 576,000 which is a new pandemic low and which is much lower than expected. Assessment of consumer sentiment by the University of Michigan was at its best since the beginning of the pandemic, although it underperformed somewhat compared to consensus expectations.
- On inflation data results, there was a slight increase in consumer prices for the month of March, by 0.6%. Core prices (which excludes food and energy) rose by 0.3%; both core and consumer prices are moderately higher than consensus expectations. There was a dramatic increase in car rental prices as reported in the Wall Street Journal, reflecting firms’ efforts at rebuilding fleets impacted by slowed auto production. The latter, in turn, appears to be the repercussion of the global chip shortage. Concerns about the possible rising inflation rate may have been quelled somewhat by policymakers’ announcement that they expect inflation to move slightly above 20% for some time.
Metals and Mining
Gold prices moved higher as bond yields soften and the US dollar declined, encouraging flights to safety. The price of gold increased by 2.4% from its Monday opening value, reaching $1,736.50 per ounce. The upward move appears to be a correction from the previous downtrend, recovering losses the saw the price of gold below the $1,700 per ounce level in the past month. It is possible for gold to move higher, given that the 10-year Treasury yields continue to encounter resistance. Yields pulled back and penetrated the 1.6 percent crucial support level, signaling greater weakness in the fixed income instrument at least for the short term. Gold ended Friday midday at $1,779.75.
Silver followed gold upward during the second week of April, but although it rose above the critical $26 per ounce, silver is still more than $2 lower than its year-to-date high. Early in the first quarter, the strong investor interest drove the price to $28.55, but this level proved unsustainable. On Friday, silver traded at $26.04 per ounce towards midday. In the meantime, both platinum and palladium rose during the week on the back of a positive economic outlook and heightened emissions standards for automotive metals. Friday valuations saw platinum at $1,198 per ounce while palladium traded at $2,668 at the week’s end.
Base metals attained overall significant gains for the week, encouraged by China’s economic recovery and industrial growth. It appears that the metal prices broke out of their consolidation formations on the upside. However, nickel and zinc remained range-bound. Copper ended the week higher by 3% from its Monday value of $8,901 per tonne. Zinc modestly increased to $2,809 on Friday from $2,759 at the session’s opening. Nickel was the only base metal to fall after its strong start, falling from $16,220 to $16,049 on Friday. Zinc also fell while lead moved up slightly. Zinc closed at $1,984.50 per tonne from $1,948.50
Energy and Oil
Due to the improvement in its demand forecast, oil gained for the week. The demand profile stayed strong despite the rise in Covid cases and the proliferation of travel restrictions. The EIA increased oil demand forecasts for 2021 by 230,000 bpd, noting the fresh round of US stimulus spending and the improvement in the vaccination rollout. In the meantime, the large oil and gas companies aim to sell off a combined $110 billion in assets mainly for the purpose of debt liquidation. They may encounter problems in finding a good price, however, as the current economic environment is not ideal for asset disposal.
The trend in oil and gas investments around the world appears anchored on environmental, social, and governance (ESG) factors. A large proportion amounting to 80% of global investors, particularly those based in Hong Kong, China, Singapore, and the UK believe in the importance of environmental and ethical issues, while currently only about 60% are invested in ESG factors. Data suggests that future investment acquisition may be linked to ESG considerations.
Natural Gas
The largest natural gas driller in the US is pushing for stricter methane limits and is supporting Congressional efforts to repeal the rollback on the limits to methane production established by the previous administration. During the past week, natural gas spot prices climbed higher at most locations during the week April 7 to April 14. There was an increase in Henry Hub spot prices, from the $2.38 per million British thermal units (MMBtu) on Wednesday the week before to $2.60/MMBtu last Wednesday. The price of the May 2021 contract at the New York Mercantile Exchange (NYMEX) rose by $0.10, from $2.520/MMBtu to $2.618/MMBtu for the week in review. The 12-month strip averaging May 2021 through April 2022 futures contract is priced higher by $0.09/MMBtu, ending at $2.835/MMBtu.
World Markets
In Europe this past week, shares rose on optimism that a strong global economic recovery is around the corner, together with the hopes of strong corporate earnings in spite of an increase in coronavirus incidences. The pan-European STOXX Europe 600 Index registered its seventh straight week of continuous gains. During the past week the Index rose by 1.20%, while France’s CAC 40 increased by 1.91%, Germany’s Xetra DAX Index gained 1.48%, and Italy’s FTSE MIB advanced by 1.28%. The UK’s FTSE 100 Index climbed 1.5% for the week.
The core eurozone bond yields inched upwards, with investors selling their existing bonds to prepare to take advantage of long-dated issues from a number of eurozone member states. It is expected that by the second quarter, Europe will be on the verge of receiving more vaccine supplies, propelling yields higher. However, upon U.S. imposition of additional sanction on Russia, yields corrected slightly lower. The core markets were tracked by yields in peripheral European economies for the week.
In Asia, China’s Shanghai Composite broad market index of A-shares suffered a 0.7% correction over the past week. The CSI 300 large-cap index fell 1.4% indicating a price dip in most technology stocks. The release of key Chinese economic data on Friday lifted markets in China and in the Asia region. The volatility in the market appeared to signal that mainland investors were uncertain a stronger GDP report will usher more liquidity tightening or if the underperformance of the industrial production sector may make authorities wary of taking more drastic regulatory measures. After a working paper from the government proposed fully lifting restrictions on family size, consumer stocks experienced a robust uptick.
Japan’s bourses were mixed for the week. The Nikkei 225 Stock Average dipped by 0.6% and the broader TOPIX also lost 0.3%, ending the trading session marginally lower. The yen lost ground against the dollar, closing the week in the upper JPY 108 level. The benchmark 10-year government bond yields finished slightly lower at 0.085%. A positive earnings outlook sustained the markets, and while the surging coronavirus cases continue to cause some concern, the markets appear to discount somewhat the effects of sustained outbreaks on the economy. Toward the week’s end, the Bank of Japan issued a cautiously optimistic economic outlook as the local business environment may be buoyed by the foreseen rise in global demand.
The Week Ahead
Among the important economic that are expected in the coming week are the Leading Economic Indicators (LEI) index and the PMI composite.
Key Topics to Watch
- Initial jobless claims (regular state program)
- Continuing jobless claims (regular state program)
- Existing home sales (SAAR)
- Leading economic indicators
- Markit manufacturing PMI (flash)
- Markit services PMI (flash)
- New home sales (SAAR)
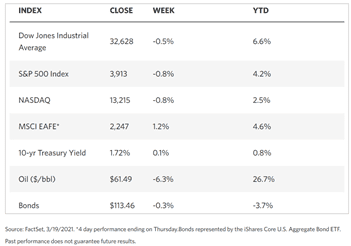
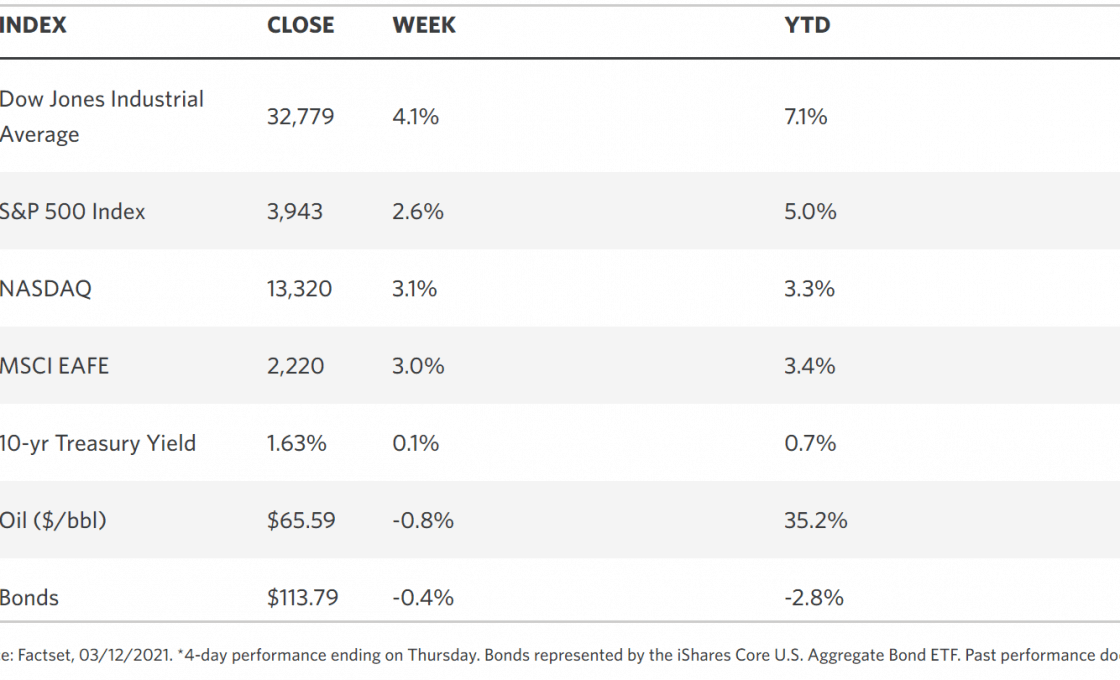
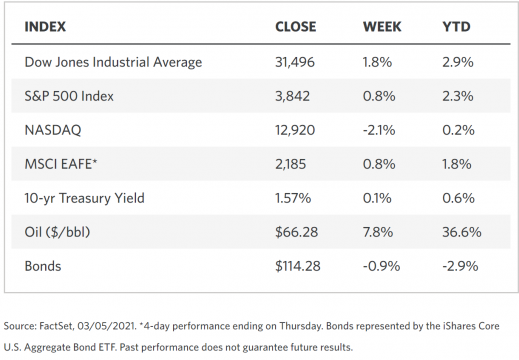
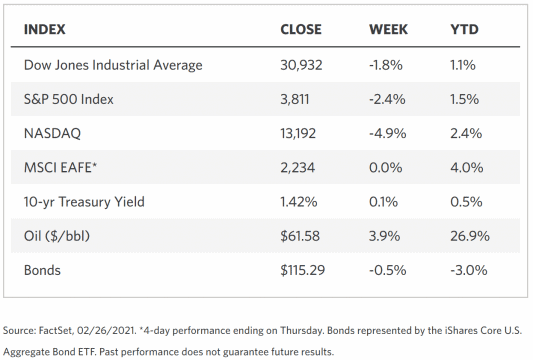
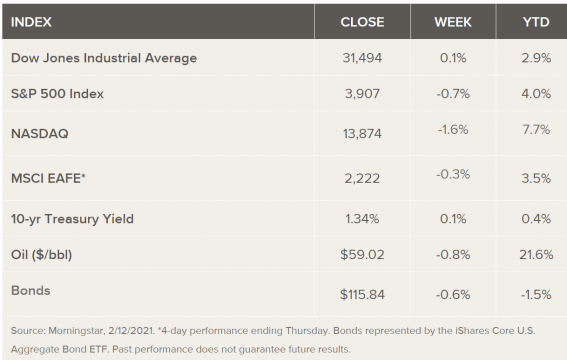
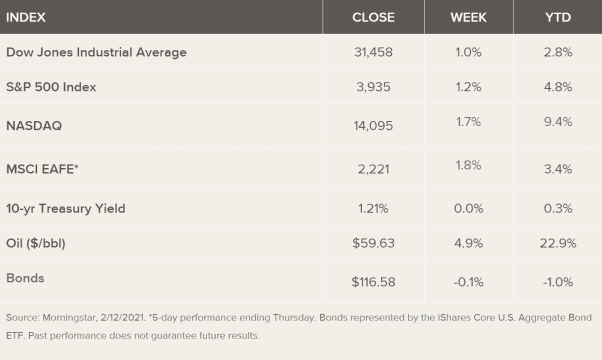
Markets Index Wrap Up