Weekly Market Review – May 27, 2023

Stock Markets

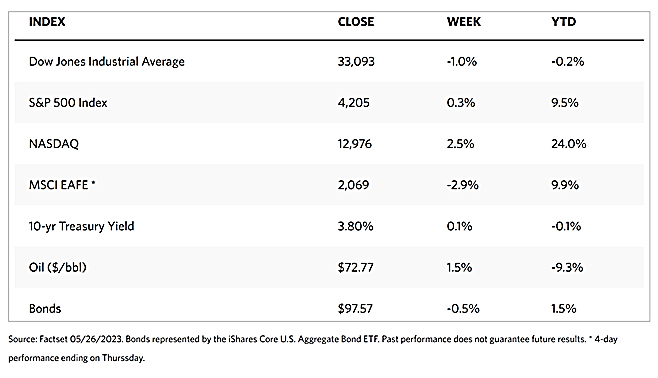
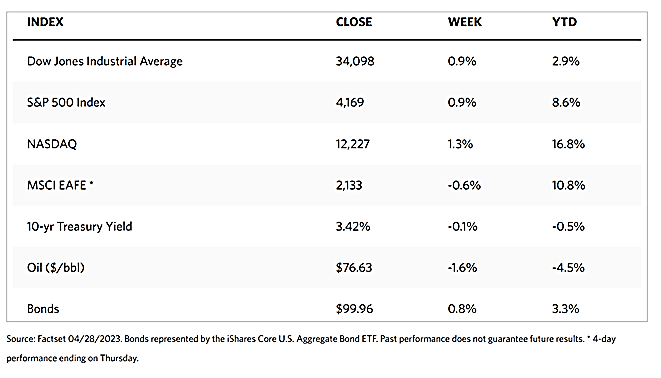
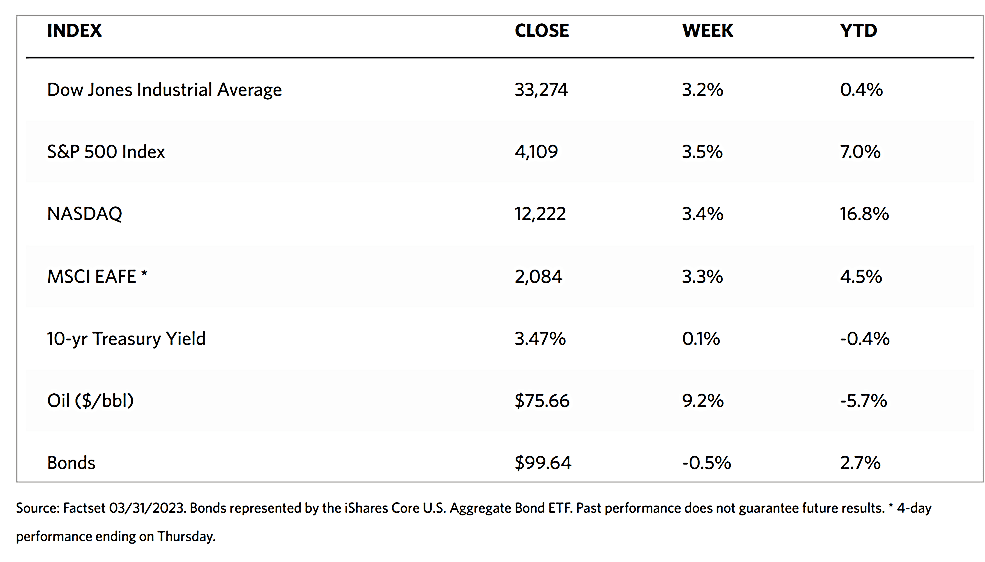
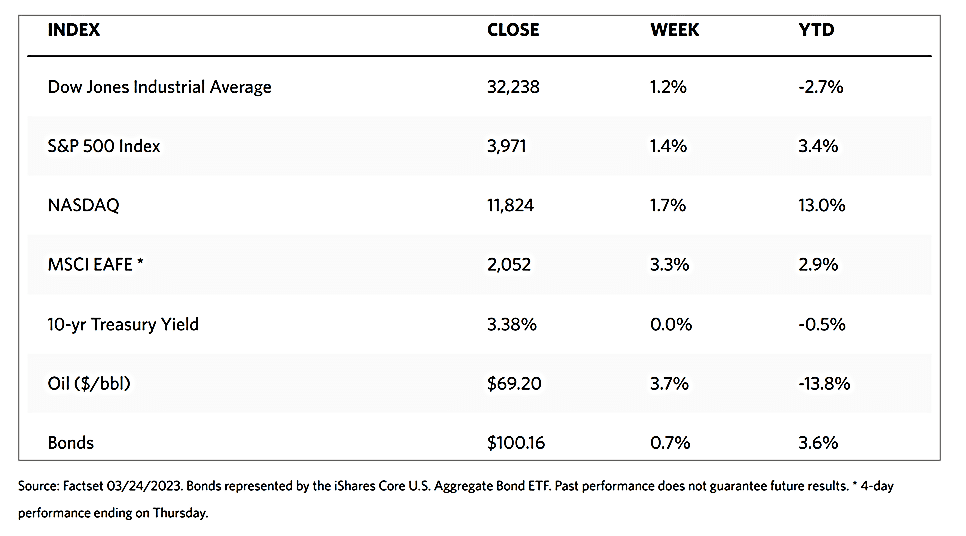
Stock markets were broadly flat in trading over the past week. The Dow Jones Industrial Average (DJIA) was slightly down by 1.00% although the Total Stock Market Index was up by 0.31%. The NYSE Composite was also down by 1.60%. However, the S&P 500 Index inched up by 0.32% while the Nasdaq Stock Market Composite, the technology tracking index, surged by 2.51%, and it ended the week up by 23.97% year-to-date. (By comparison, the narrowly-focused DJIA declined by 0.16% over the same period.) CBOE Volatility Index rose by 6.78% reflecting an increase in investors’ perceived market risk.

While other sectors moved sideways on listless trading, one sector – information technology – overperformed the rest with a stellar 4.0% rise for the week. The technology sector is just one of three sectors in the S&P 500 Index that remains in positive territory year-to-date, together with consumer discretionary and communication services. Technology and communications services are well into bull-market territory as they are now up over 30% for the year.  However, each of the other S&P 500 sectors remains negative so far for this year, possibly in reaction to the uncertainty regarding the stymied U.S. debt-ceiling negotiations, the future Fed action on interest rate hikes, and the potential softness in the economy.

The stellar performer during the week was chipmaker NVIDIA. On Thursday, the company’s shares jumped by 24% after it beat consensus first-quarter earnings expectations by a wide margin and raised its profit outlook. The large move in this heavily weighted stock took the company’s market capitalization to about $963 billion by the end of the week, landing it sixth among the most highly valued public company in the world. This sent shock waves among the major benchmarks, making Thursday among the most remarkable trading sessions in the last 25 years.

U.S. Economy

In a runup to the June 14 Federal Reserve meeting, Fed officials in recent weeks have indicated that their focus remains squarely on fighting inflation as it remains too elevated for comfort. Although trends have improved in headline inflation, the personal consumption expenditure price index, or PCE, inflation data released during the week oved higher, and services inflation remains steadily persistent, driven by a robust labor market and wage growth that remains stubbornly elevated. The U.S. GDP growth for the first quarter announced last week was also revised upwards, though modestly, to 1.3% annualized, compared to what was previously 1.1%. Consumption remains resilient at 3.8%. The Fed’s own GDO-Now tracker is presently indicating a solid 2.9% annualized growth rate for the second-quarter U.S. GDP.

Fed officials have been wondering if further rate hikes may be prudent to continue to dampen inflation, given the strong labor market and broadly healthy economic situation. Markets appear to be pricing in one additional rate hike by the Fed, probably during the June or July meeting. This would bring the Fed funds rate to 5.25% to 5.5%. Some of this is reflected in Treasury yields moving higher in recent days. The Fed may likely lean towards a temporary halt in rate hikes for the moment, particularly in light of the recent uncertainty in the regional banking sector and some tightening of credit conditions. Should the upcoming U.S. nonfarm jobs report and CPI inflation data for May show some cooling as expected, this could help determine the future direction of interest rates.

Metals and Mining

The release last week of upbeat economic data and persistently high inflation hammered the gold market. This is the third consecutive weekly loss of the precious metal’s price as the markets recalibrated for another 25-basis-point rate hike in June. Despite the selloff this week, the year-to-date price of gold is still up by more than 6%. The macro-data was the main factor that weighed down the precious metal by the end of the recent trading week. All broadly above expectations were personal spending, the durable goods statistics, and the PCE inflation measures, particularly since the PCE price index, the Fed’s preferred inflation indicator, ended at 4.7% in April. Inflation close to 5% did not justify a pause by the Fed in hiking interest rates in June, for which there is now a 60% probability of a rate increase. Gold prices may therefore be subdued for the second quarter and possibly the early part of the third quarter.

In the past week’s trading, spot prices for precious metals came down. Gold descended by 1.59% from the week-ago price of $1,977.81 to this week’s close at $1,946.46 per troy ounce. Silver closed 2.31% lower, from the previous week’s close at $23.85 to this week’s close at $23.30 per troy ounce. Platinum is down by 3.77% from last week’s close at $1,066.59 to this week’s close at $1,026.37 per troy ounce. Palladium, which was at $1,514.72 one week ago, ended at $1,426.25 per troy ounce this week, losing by 5.84%. The three-month LME prices for base metals were also generally down for the week. Copper lost by 1.41% from its week-ago price of $8,251.50 to this week’s price of $8,135.00 per metric tonne. Zinc closed this week at $2,343.50 per metric tonne, lower by 5.47% from last week’s price of $2,479.00. Aluminum ended this week at $2,237.50 per metric tonne, down by 2.01% from last week’s price of $2,283.50. Tin closed this week at $24,846.00 per metric tonne, lower by 2.38% from last week’s close at $25,451.00.          

Energy and Oil

Fears of a U.S. government shutdown have eased this week as the debt ceiling negotiations appear to be moving toward a resolution. The development has also eased some of the pressure on oil prices. Russia and Saudi Arabia continue to confuse the market with conflicting messages. One day after the Saudi energy minister warned market short-sellers of the possibility they would get burned should prices reverse, Russia’s deputy prime minister, Alexander Novak, doused expectations of a production cut at the June 4 meeting of OPEC+, stating that he does not anticipate new steps to be taken. Consequently, WTI and Brent have both trended sideways, at $72 and $76 per barrel, respectively. In the meantime, the U.S. government will hold a sale of oil and gas drilling rights on federal lands in New Mexico and Kansas, covering more than 10m000 acrease with two-thirds of acreage on offer in Cheyenne County, KS. This is the first block auction since the IRA was passed last year.

Natural Gas

For the report week beginning Wednesday, May 17, and ending Wednesday, May 24, 2023, the Henry Hub spot price fell by $0.01 from $2.25 per million British thermal units (MMBtu) on May 17 to $2.24/MMBtu on May 24. The price of the June 2023 NYMEX contract increased by $0.033, from $2.365/MMBtu at the beginning of the report week to $2.398 by the end of the week. The price of the 12-month strip averaging June 2023 through May 2024 futures contracts rose by $0.039 to $3.099/MMBtu. Natural gas spot prices fell at most locations for the report week. Price changes at major pricing hubs ranged from a decline of $0.95/MMBtu at PG&E Citygate to an advance of $0.42/MMBtu at the Waha Hub.

International natural gas futures prices decreased for this report week, The weekly average front-month futures prices for liquefied natural gas (LNG) cargoes in East Asia fell by $0.90 to a weekly average of $9.73/MMBtu. Natural gas futures for delivery at the Title Transfer Facility (TTF) in the Netherlands, the most liquid gas market in Europe, fell by $1.18 to a weekly average of $9.27/MMBtu. Last year, for the week corresponding to this report week (the week ending on May 25, 2022), the prices were $22.10/MMBtu and $27.16/MMBtu in East Asia and at the TTF, respectively.

World Markets

European equities plunged on investors’ sentiment that the economic outlook will likely worsen and uncertainty will continue over the U.S. debt ceiling talks. The pan-European STOXX Europe 600 Index lost by 1.59%, and so, too, did major indexes in the region weaken. Germany’s DAX fell by 1.79%, France’s CAC 40 Index declined by 2.31%, and Italy’s FTSE MIB dropped by 2.93%. The UK’s FTSE 100 Index slid by 1.67%. Due to concerns that central bank policymakers would extend their policy tightening to address inflationary pressures, European government bond yields broadly climbed. The yield on the benchmark 10-year German government bond came to rest above 2.5%, while Spain’s and Italy’s sovereign bond yields rose likewise. Robust core inflation data drove a broad sell-off in the UK bond markets, with the yield on the benchmark 10-year UK government bond approaching 4.3%.  According to official figures, the German economy lapsed into recession in the first quarter. Meanwhile, UK inflation in April slowed less than forecasted to an annual rate of 8.7%, from 10.1% in March.

In Japan, the Nikkei 225 benchmark touched a 33-year high early in the week before ending just below the 31,000 level. This was the Nikkei 225’s highest close since July 1990, propelled by upbeat economic data and optimism regarding the U.S. debt ceiling negotiations. The broader TOPIX index closed the week slightly lower. Japanese manufacturing activity grew for the first time in seven months in May. Also reporting strong growth was the services sector. The return of domestic and international tourism spearheaded a record rise in business activity. Data also showed that Japan’s core machinery orders fell for a second straight month in March, although the optimistic market sentiment shrugged off any negative indicators for the week. Benchmark yields spiked noticeably on Friday, rising above 0.45% on positive news about the U.S. debt ceiling. The 10-year government bond yields settled around 0.41% by Friday’s close.

The Chinese stock market fell upon the release of several disappointing economic indicators in recent weeks pointing toward a slowing recovery. The benchmark CSI 300 Index dipped by 2.4%, its biggest weekly decline since the five days ended March 10, and erasing all its gains this year. Hong Kong’s benchmark Hang Seng Index plunged below the psychological key support at 19,000 to its lowest close since December in a holiday-shortened trading week. While there were no major indicators or policy measures announced during the week, mounting evidence that China’s post-pandemic recovery is losing momentum raised concerns about its economic outlook. In more recent announcements, retail sales, industrial output, and fixed asset investment all grew at rates that were weaker than expected in April. Credit growth indicators likewise pointed to sluggish domestic demand. The yield on China’s 10-year government bond descended to a six-month low of 2.70% last week.

The Week Ahead

In the coming week, the labor market, consumer confidence, and job openings data are among the important economic data scheduled to be released. All markets shall be closed on Monday in commemoration of Memorial Day.

Key Topics to Watch

  • S&P Case-Shiller home price index (20 cities)
  • Consumer confidence
  • Richmond Fed President Barkin speaks
  • ADP employment
  • Chicago Business Barometer
  • Job openings
  • Philadelphia Fed President Patrick Harker speaks (Wed.)
  • Federal Reserve Beige Book
  • Initial jobless claims
  • U.S. productivity
  • IS&P U.S. manufacturing PMI
  • ISM manufacturing
  • Construction spending
  • Philadelphia Fed President Patrick Harker speaks (Thur)
  • U.S. employment report
  • U.S. employment rate
  • U.S. hourly wages
  • Hourly wages year-over-year

Markets Index Wrap Up

Weekly Market Review – May 20, 2023

Stock Markets

Major stock indexes chalked solid gains for the week, with the S&P 500 Index rising above the 4,200 level in intraday trading for the first time since late August before retracing back to close at 4,191.98. It gained by 1.65% for the week, while the Dow Jones Industrial Average (DJIA) rose by 0.38% and the Total Stock Market Index mirrored the S&P 500 with a rise of 1.68%.  The Nasdaq Stock Market Composite climbed by 3.04%, while the NYSE Composite inched up by 0.51%. The risk perception tracker CBOE Volatility Index slid down by 1.29%, based on the weekend tally by Wall Street Journal Markets.

The stock indexes have remained range-bound for the past few months, trading within a relatively narrow margin, with the S&P 500 Index ending the week up by only 0.93% for the year to date. The strong performance was attributed to some mega-cap technology-related stocks. Google parent Alphabet registered particularly strong gains as well as Facebook parent Meta Platforms. Other outperformers were Advanced Micro Devices (AMD), NVIDIA, and other chipmakers. Some regional bank shares rallied to recover some of their recent losses, resulting in a regional bank exchange-traded fund (ETF) registering its best daily gain since early 2021 on Wednesday.

The boost in performance within the week may be attributed to the increasingly optimistic tone regarding debt ceiling negotiations. After a meeting on Wednesday to discuss the stymied negotiations, President Biden commented that he was confident there would be no default, while Republican House Speaker Kevin McCarthy said that the deal was “doable.” The stock market seemed to lose steam on Friday, however, after Republican negotiators mentioned that they would pause the negotiations.

U.S. Economy

In recent economic news, consumption growth was recorded at 3.7% in the first quarter, the best pace in two years. The particularly strong consumer spending growth may, however, signal the start of waning consumer vigor and the onset of fatigue. Gasoline sales slowed while sporting goods and home furnishing weakened. Major retailers still reported stronger-than-expected performance, raising April retail sales overall following two straight months of declines. Nevertheless, some softness has more recently emerged in smaller tickets and less demand for discretionary items such as clothing, electronics, and home goods.

While wage growth remains healthy, unemployment is at a half-century low. Signs of softening employment conditions are beginning to surface, although the labor market will continue to remain a source of energy for consumers. A sign of the post-pandemic economy has been the tight labor market, which supports elevated consumer demand while preventing inflation from coming down more quickly. Continuing jobless claims are significantly up from the same time last year, indicating that jobs are increasingly becoming harder to find, possibly signaling a broader return to the workforce. The year-over-year increase in pay for job switchers has declined considerably from its peak, another sign that wage growth will further moderate.

There is a possibility that the economy is headed toward a recession, although this has already been earlier discounted by the markets, and may, therefore, cause a milder drop than previous recessions. Due to the strength in the labor market and relative resilience in consumption, the coming recession may be softer than that in 2001.

Metals and Mining

The dramatic run-up in gold prices since November may just have scratched the surface of the potential for the precious metal. The combination of real interest rates, quantitative easing, debt, and deficits is poised to propel the investment market share of gold to what should be the four-decade mean at a minimum. Experts say that people’s concern about maintaining their purchasing power is the driving force behind the price of gold. Gold’s upward trajectory may be sustained in the medium term, although its pace will be slower if the government continues to raise nominal interest rates.

In the week just ended, the spot price of gold ended at $1,977.81 per troy ounce, a drop of 1.64% from its week-ago close at $2,010.77. Silver came from $23.97 to land this week at $23.85 per troy ounce, a slight downward correction of 0.50%. Platinum, which closed the previous week at $1,053.04, closed this week at $1,066.59 per troy ounce for a gain of 1.29%. Palladium ended the prior week at $1,512.77 and this week at $1,514.72 per troy ounce, a gain of 0.13%. The three-month LME prices of base metals were mixed for the week. Copper closed the week at $8,251.50, down by 0.02% from the previous week’s close at $8,253.00. Zinc ended this week at $2,479.00 per metric tonne, down by 2.75% from the previous week’s close at $2,549.00. Aluminum closed at $2,283.50 this week, locking in a gain of 3.28% from the previous week’s close at $2,211.00. Tin came from a close the prior week at $25,308.00 and ended this week at $25,451.00 for a gain of 0.57%.

Energy and Oil

Oil prices appear to have finally broken out of the downside pressures and increasingly bearish sentiment that characterized the past month, and may be set for their first weekly gain in a month. A great amount of that optimism was provided by the U.S. as debt ceiling negotiations may be likely to head towards a resolution after last Wednesday’s meeting between President Biden and Speaker McCarthy. Gasoline demand is also showing some strength after another week-on-week drop in the inventory. In the international scene, a group of Western countries led by the U.S. and the U.K. has called for increased surveillance over the growing practice of ship-to-ship crude transfers, carrying either Russian or Iranian oil, as these transfers increase the risk of maritime oil spills. Also, India is intent on replenishing one-quarter of its strategic petroleum reserves, which are substantially lower than the U.S. or Chinese SPRs at a mere 39 million barrels. Nevertheless, reports suggest that they may buy about 9.2 million barrels in the coming months.

Natural Gas

For the report week beginning Wednesday, May 10, and ending Wednesday, May 17, 2023, the Henry Hub spot price rose $0.13 from $2.12 per million British thermal units (MMBtu) at the start of the week to $2.25/MMBtu at the end of the week. The price of the June 2023 NYMEX contract increased by $0.174, from $2.191/MMBtu on May 10 to $2.365/MMBtu on May 17.  The price of the 12-month strip averaging June 2023 through May 2024 futures contracts climbed $0.143 to $3.060/MMBtu. At most locations this report week, prices rose with few exceptions. At major pricing hubs, price changes ranged from an increase of $1.12/MMBtu at the Waha hub in West Texas to a decrease of $0.03/MMBtu at PG&E Citygate in Northern California.

International natural gas futures prices decreased this report week. Weekly average front-month futures prices for liquefied natural gas (LNG) cargoes in East Asia dropped by $0.65 to a weekly average of $10.62/MMBtu. Natural gas futures for delivery at the Title Transfer Facility in the Netherlands, the most liquid natural gas market in Europe, declined by $1.17 to a weekly average of $10.44/MMBtu. In the corresponding week last year (the week ending May 18, 2022), the prices were $21.65/MMBtu and $29.72/MMBtu in East Asia and at the TTF, respectively.

World Markets

European shares advanced this week, driven by optimism that interest rates may be close to peaking and that the U.S. is likely to avoid a debt default. The pan-European STOXX Europe 600 Index closed the week ahead by 0.72% from last week. The major markets reflected this trend, with Germany’s DAX surging by 2.27% and France’s CAC 40 Index rising by 1.04%. European government bond yields rose higher on the back of growing confidence in the European economy coupled with the imminent breakthrough in debt ceiling negotiations in the U.S. The yield on the 10-year German bond climbed to 2.5%, its highest level in more than three weeks. In the U.K., the benchmark 100-year gilt yield rose above 4% due to hints by policymakers that if inflationary pressures do not moderate, more monetary tightening could be forthcoming. Official economic data suggests that Europe might be headed toward an industrial recession. Eurozone industrial production plummeted by 4.1% sequentially in March, after rising by 1.5% in February. Industrial output sank by 1.4% on a year-over-year basis, after increasing 2.0% in the preceding month. Irish production led the drop, although German, French, and Italian output also weakened.

Japanese stocks recorded their sixth consecutive weekly gain. The Nikkei 225 Index advanced by 4.8% while the broader TOPIX Index jumped by 3.1%. Both indexes approached their 33-year highs during the week driven by solid domestic earnings, yen weakness, and strong overseas purchases of Japanese stocks. The sentiment was also boosted by data indicating that Japan’s economy grew at a higher-than-expected pace for the first quarter of this year, partly due to a post-Covid increase in consumption. Further adding to investors’ optimism was the perception that the U.S. government would soon reach a deal on raising the debt ceiling. The yield on the 10-year Japanese government bond rose to 0.39% from 0.37% at the end of the previous week. During the week, it dipped to its lowest since March as the Bank of Japan (BoJ) continued to maintain its commitment to ultra-loose monetary policy. The yen weakened significantly to around JPY 138.17 against the U.S. dollar, from its level the previous week at JPY 135.75. Some of the yen’s depreciation was stemmed by strong inflation data toward the end of the week.

Amid concerns that China’s post-Covid recovery may be losing steam, Chinese stock markets moved sideways as equities ended the week mixed. The Shanghai Stock Exchange Index marginally rose by 0.34% while the blue-chip CSI 300 inched up 0.17% in local currency terms. In Hong Kong, the benchmark Hang Seng Index lost by 0.90%. According to official data, industrial output, retail sales, and fixed asset investment grew at a weaker-than-expected pace in April year-on-year. Unemployment dipped to 5.2% in April compared to 5.3% in March, although youth unemployment jumped to a record 20.4%. This raised concerns that the post-pandemic recovery is not robust enough to attract new talent. Investors were disappointed at the latest figures, although the data appeared to be an improvement over that of the previous year when China was still under lockdown. On Friday, China’s yuan currency depreciated at the fastest pace in nearly three months after the PBOC cut its central parity rate below RMB 7 per dollar for the first time since December. The local currency was weighed down by signs of slowing growth in China and a surge in the U.S. dollar prompted by the likelihood that the U.S. government would raise its debt ceiling in time to avoid a default.

The Week Ahead

The PMI data, FOMC Minutes, and Preliminary Q1 GDP data are scheduled for release in the coming week.

Key Topics to Watch

  • St. Louis Fed President James Bullard speaks
  • San Francisco Fed President Mary Daly speaks
  • Atlanta Fed President Raphael Bostic, Richmond Fed President Tom Barkin speak
  • Dallas Fed President Lorie Logan speaks
  • S&P flash U.S. services PMI
  • S&P flash U.S. manufacturing PMI
  • New home sales
  • Fed Gov. Christopher Waller speaks
  • Minutes of Fed May FOMC meeting
  • GDP (second reading)
  • Initial jobless claims
  • Richmond Fed President Tom Barkin speaks
  • Pending home sales
  • Durable-goods orders
  • Durable-goods minus transportation
  • Personal income (nominal)
  • Personal spending (nominal)
  • PCE Index
  • Core PCE Index
  • PCE (year-over-year)
  • Core PCE (year-over-year)
  • Advanced U.S. trade balance in goods
  • Advanced retail inventories
  • Advanced wholesale inventories
  • Consumer sentiment (final)

Markets Index Wrap Up

Weekly Market Review – May 13, 2023

Stock Markets

This trading week, major stock indexes are down except for the Nasdaq Stock Market Composite which managed to rise by 0.40%. Data from the Wall Street Journal (WSJ) Markets report show the Dow Jones Industrial Average (DJIA) falling by 11.1% while the total stock market lost by 0.11%.  The broad-based S&P 500 receded by 0.29% and the NYSE Composite Index slid by 0.87%. The CBOE Volatility Index, which serves as the indicator of investors’ risk perception of the market, dipped by 0.93%. Investors’ risk perception may be abating due to some encouraging news on inflation released during the week.

There was some trading incentive during the week as the flow of first-quarter earnings reports neared its end. The outperformance of the technology-heavy Nasdaq Composite was helped by a buying surge in Alphabet, Google’s parent company, in reaction to the unveiling of its new artificial intelligence (AI)-based platform. The lag in the narrowly-focused DJIA could be attributed to the reported decline in subscribers to Disney’s streaming platform, Disney+. Furthermore, the financial sector underperformed, being weighed down by concerns over the challenges facing regional banks in general. Trading volumes remained thin and neared their lowest level of the year. While the week’s economic calendar provided little trading motivation, it did include the highly anticipated inflation data released on Wednesday. After the Labor Department reported that headline consumer prices rose 4.9% over the year ended in April, the S&P 500 Index jumped by 1% in premarket trading. The inflation reading was slightly below consensus expectations and amounted to the slowest pace n two years. 

U.S. Economy

The April consumer price index (CPI) announced on Wednesday was slightly cooler than the 5.0% consensus expectation and below last month’s 5.0% reading. It was the smallest increase since April 2021 and continued the disinflation trend, being the 10th consecutive month of improvement since June of last year when inflation peaked at 9.1%. While gasoline prices rose month-on-month, this was offset by a fall in food prices. Food inflation is still high at an annual 7.1%, however, it is down from 13.5% in August.

Core inflation, which excludes food and energy, inched down to 5.5% from 5.6%. Although core inflation met expectations, the price increase was partially driven by a sudden increase in used car prices which is seen as a temporary development and is not likely to persist. As with previous months, the single largest contributor to inflation was housing. However, we may start to see shelter inflation come down in the summer months based on the historical lag between when inflation of newly signed rental contracts falls and when it shows up in the official data.

The most encouraging news on the reports is possibly that core services inflation excluding shelter (a function of the labor market) improved significantly. This is the measure that the Fed has been highlighting as the basis for its restrictive monetary policy in recent months. Core services inflation was reported to have risen at the slowest pace in nine months. It appears that the labor market tightness is starting to ease, suggested by the fact that jobless claims over the past month rose to a one-year high, which should help cool wage growth. Thus, consumer inflation remains on its downward trajectory. The pace and duration of declines in inflation once it has peaked have been historically symmetrical to its way up. If this holds, inflation may fall toward 3% by the end of 2023, which would be a significant development, considering the height of the peak. The Federal Reserve may have room to pause its rate hikes, which is good news for the markets.

Metals and Mining

Since prices remain well below last week’s test of its all-time high above $2,080 per ounce, it appears that the gold market may be losing some of its bullish momentum, Nevertheless, the yellow precious metal continues to attract much investor attention. Several experts continue to speculate that there may be a hard landing ahead for the U.S. economy, which is historically not favorable for gold and silver. However, geopolitical uncertainty and the growing de-dollarization trend are seen to continue to support precious metals. In any case, there is one thing that continues to drive interest in gold, and that is central bank demand which is seen to continuously persist. Last week, the World Gold Council revealed that in the first quarter, central banks bought 228 tonnes of gold, which is a record start for the year.

During the trading week just ended, there has been some correction in the spot prices of precious metals. Gold, which closed a week ago at $2,016.79, ended this week at $2,010.77 per troy ounce, for a slight reduction of 0.30%. Silver ended this week at $23.97 per troy ounce, representing a 6.62% drop from its previous week’s close at $25.67. Platinum closed this week at $1,053.04 per troy ounce, 0.89% lower than the previous week’s close at $1,062.52. Palladium bucked the trend and closed this week at $1,512.77 per troy ounce, an increase of 1.17%    over its previous week’s close at $1,495.31.  The three-month LME prices of basic metals were generally lower this week compared to the previous week. Copper ended at $8,253.00 per metric tonne this week, down by 3.83%     over the previous week’s close at $8,581.50. Zinc ended this week at $2,549.00 per metric tonne, down by 5.12% over the prior week’s close at $2,686.50. Aluminum closed at $2,211.00 per metric tonne this week, down by 4.64% from its price last week at $2,318.50.  Tin ended this week at $25,308.00 per metric tonne, down by 2.90% from its week-ago close at $26,064.00.     

Energy and Oil

The slide in oil prices continues this week as fears of a recession were aggravated by a reversal in crude inventory draws. The Department of Energy (DOE), in a carefully-worded announcement, declared that they may start refilling SPRs. This week, U.S. Energy Secretary Jennifer Granholm informed Congress that the DOE could start repurchasing crude for the Strategic Petroleum Reserve as soon as the currently ongoing congressionally mandated sales are concluded. The announcement, however, failed to spark a sustainable price recovery. OPEC sought to intervene with its monthly report, increasing Chinese demand growth this year to 800,000 barrels per day (b/d). Nevertheless, these attempts at altering the broader narrative are failing to incentivize higher prices in the market.

Natural Gas

For the report week from Wednesday, May 3, to Wednesday, May 10, 2023, the Henry Hub spot price rose by $0.09 from $2.03 per million British thermal units (MMBtu) at the start of the week to $2.12/MMBtu by the week’s end. The price of the June 2023 NYMEX contract increased by $0.021, from $2.170/MMBtu on May 3 to $2.191/MMBtu on May 10. The price of the 12-month strip averaging June 2023 through May 2024 futures contracts fell by $0.025 to $2.917/MMBtu. International natural gas futures prices decreased for this report week. The weekly average front-month futures prices for liquefied natural gas (LNG) cargoes in East Asia fell by $0.26 to a weekly average of $11.28/MMBtu.  Natural gas futures for delivery at the Title Transfer Facility (TTF) in the Netherlands, the most liquid natural gas market in Europe, fell by $0.71 to a weekly average of $11.61/MMBtu. In the corresponding week last year, the week ending May 11, 2022, the prices were $23.54/MMBtu and $30.59/MMBtu in East Asia and at the TTF, respectively.

World Markets

European stocks moved sideways for the week due to a lack of major news that would move the markets. The pan-European STOXX Europe 600 Index ended the week virtually unchanged in local currency terms, despite strong gains early in the week that dissipated as the market discounted the likelihood of further rate increases from the European Central Bank (ECB). Major stock indexes posted mixed results. Germany’s DAX slipped by 0.30%, while France’s CAC 40 Index dipped by 0.24%. The UK’s FTSE 100 Index ended marginally lower by 0.31%.  ECB President Christine Lagarde stated in an interview that the central bank has so far moved deliberately and decisively to fight inflation, but that there remains more ground to cover. “There are factors that can induce significant upside risks to the inflation outlook” and that uncertainty regarding inflation remains high, demanding that the ECB pay close attention to the potential risks.

Japan’s stock markets charted gains over the week on the back of signs of strength in corporate earnings. The Nikkei 225 Index rose by 0.8% and the broader TOPIX Index climbed by 1.0% higher. Investor sentiment was tempered somewhat by concerns about China’s economic growth as well as the U.S. debt ceiling and potential default. Nevertheless, data released during the week showed that wage growth remained sluggish in March, which supported the Bank of Japan’s (BoJ) dovish stance. On the back of these developments, the yield on the 10-year Japanese government bond fell from 0.42% at the end of the previous week to 0.39% at the end of this week. The yen rose modestly to around JPY 134.75 against the dollar, from JPY 134. 85 the previous week.

Chinese stocks retreated during the first full week of trading after the five-day Labor Day holiday, due to investors’ concerns about the strength of the country’s recovery. The Shanghai Stock Exchange Index declined by 1.86% while the blue-chip CSI 300 dipped even lower, by 1.97% in local currency terms. Hong Kong’s benchmark Hang Seng Index descended by 2.11%. China’s consumer price index (CPI) inched up 0.1% in April from last year, down significantly from an increase of 0.7% in March. The most recent CPI is the lowest rate since February 2021 and missed economists’ forecasts. Core inflation (which excludes volatile food and energy prices) remained unchanged from the previous month, indicating little demand-driven inflation in the economy. The recent data suggests that China’s central bank may ease policy in the near term to support an economic recovery that is showing signs of losing momentum after the post-pandemic rebound. The yield on China’s 10-year government bond fell to the lowest level since November as traders priced in the possibility of further monetary easing.

The Week Ahead

In the coming week, important economic data scheduled for release include housing data, retail sales growth, industrial production, and capacity utilization.

Key Topics to Watch

  • Empire State manufacturing survey
  • Chicago Fed President Goolsbee on TV
  • Minneapolis Fed President Kashkari speaks
  • Cleveland Fed President Mester speaks
  • U.S. retail sales
  • Retail sales minus autos
  • Industrial production
  • Capacity utilization
  • Business inventories
  • Home builder confidence index
  • Fed Vice Chair Barr testifies
  • Richmond Fed President Barkin speaks
  • New York Fed President Williams speaks
  • Chicago Fed President Goolsbee on TV
  • Atlanta Fed President Bostic and Chicago Fed President Goolsbee on panel
  • Housing starts
  • Building permits
  • Philadelphia Fed factory survey
  • Initial jobless claims
  • Fed Gov. Philip Jefferson speaks
  • Fed Vice Chair for Supervision Barr testifies
  • Existing home sales
  • U.S. leading economic indicators
  • New York Fed President Williams speaks
  • Fed Chairman Powell and former Fed Chairman Bernanke on panel

Markets Index Wrap Up

Weekly Market Review – May 6, 2023

Stock Markets

The major indexes were generally down due to the triple negative data reports released for the week. The Dow Jones Industrial Average (DJIA) fell by 1.24% and while its transportation and utilities averages rose, the total stock market slid by 0.77%. The broad S&P 500 Index lost by 0.80%, and the NYSE Composite declined by 1.06%. Bucking the trend was the Nasdaq Stock Market Composite, which managed to gain by 0.07%. The CBOE Volatility index, which tracks investor risk perception, advanced by 8.94% in reaction to the higher volatility in the market.

The negative developments during the week were the Federal Reserve interest rate hike of 0.25%, the ongoing turmoil in the banking system, and a key jobs report for April. The Fed may finally be considering a pause in its rate-hiking policy after raising interest rates by more than 5.0% in slightly over a year, however, the past year’s rate hikes may only now be starting to impact the real economy. Market volatility may increase following a market really, though it may be characterized by thin equity leadership. A bull market in stocks and bonds is still possible by year-end as the ongoing bear market loses its steam.

Despite Friday’s brief rally, the drop in the broad S&P 500 Index is seen as due to comments by Federal Reserve Chair Jerome Powell that suggested that anticipated interest rate cuts may not take place as quickly as investors had hoped. Sentiments may have also been weighed down by uneasiness surrounding the need to raise the U.S. debt ceiling. U.S. Treasury Secretary Janel Yellen notified congressional leaders that the agency may not be able to meet its debt obligations as early as June 1, raising prospects of a government default. The information technology sector fared the best and ended higher, as seen in the Nasdaq close. Yields on 10-year U.S. Treasuries slumped early in the week on the back of concerns surrounding regional banks and the debt ceiling, although the drop moderated during Friday’s trading session.

U.S. Economy

Over the weekend, California-based First Republic Bank was taken over by regulators due to its struggle with large deposit outflows similar to those earlier encountered by Silicon Valley Bank and Signature Bank. Most of First Republic Bank’s assets were acquired by JP Morgan Chase; deposits not covered by federal insurance did not suffer losses. Significant volatility in stock trading in this sector of the S&P 500 reflected heightened concerns regarding the potential for additional bank failures and the credit pressures that could materialize if the economy slows down and unemployment accelerates.

The uncertainty in the regional banking system and incremental tightening in lending standards, to a weakening in manufacturing and the housing sector, may be symptoms of the lagging effects of the accelerated interest rate hikes by the Fed. A mild recession is therefore likely, although the economy is still buffered by a relatively resilient labor market. Data from the U.S. Department of Labor indicated that the number of job openings shrank for the third straight month in March, dropping to 9.59 million from 9.97 million. Small businesses that have up to 49 employees carried the brunt of the decline. With 1.6 job openings for every unemployed person, the labor market remains tight. Layoffs were recorded at 1.8 million in the same report; this chalks an increase of 248,000, the highest level since December. Likewise, a nonfarm payrolls report that was issued on May 5 showed some strength in the labor market as the economy added 253,000 new jobs in April. This is higher than the consensus estimate of 179,000 and the 165,000 job gains recorded in March. Average hourly earnings rose by 0.5% month-over-month, compared with the reported uptick of 0.3% in March.

Metals and Mining

Gold prices this week tested record highs above $2,080 an ounce, once more showing investors the potential of the gold market to rally higher. While there is much long-term bullish sentiment in the market, the conditions for a sustained rally do not yet appear to be in place. Gold’s push to $2,085 per ounce came after the Fed raised interest rates by 25 basis points and shifted to a more neutral monetary policy. While the central bank appears to pause in raising interest rates further, Fed Chair Jerome Powell’s statements definitively indicate that they are in no position to be cutting rates anytime soon. According to Powell in Wednesday’s press conference, it is the Fed’s view that “inflation is going to come down not so quickly. It will take some time, and in that world, if that forecast is broadly right, it would not be appropriate to cut rates and we won’t cut rates.”

This past week, gold spot price closed at $2,016.79 per troy ounce, 1.35% higher than its close last week at $1,990.00. Silver, which previously closed at $25.05, rose by 2.48% to end this week at $25.67 per troy ounce. Platinum dipped 1.46% from last week’s close at $1,078.31 to end this week at $1,062.52 per troy ounce. Palladium came from the previous week’s close at $1,506.87 to this week’s close at $1,495.31 per troy ounce, for a loss of 0.77%. The three-month LME prices of base metals were mixed for the week. Copper, which was previously $8,595.50, ended this week at $8,581.50 per metric tonne for a slight drop of 0.16%.  Zinc ended this week at $2,686.50 per metric tonne, a gain of 1.47% from the previous week’s end at $2,647.50. Aluminum came from last week’s price of $2,356.00 to this week’s ending price of $2,318.50 per metric tonne for a slight drop of 1.59%. Tin also lost by 0.09% from the previous week’s close at $26,088.00 to this week’s close at $26,064.00 per metric tonne.

Energy and Oil

The past week was one of the worst weeks for oil prices in recent memory. The doom and gloom surrounding the global economy failed to be shaken by any bullish news, and while a slight rebound in oil prices materialized on Friday morning that reduced the weekly loss, the sentiment remained decidedly bearish for the oil industry. Both the ICE Brent and WTI plunged by 10% week-on-week before Friday’s slight rebound. Bearish sentiment was driven by renewed concerns about a U.S. banking crisis contagion and lukewarm industrial figures from China. News that should have perked up oil prices, such as hijacked tankers on the Strait of Hormuz, falling U.S. inventories, and the lack of a deal to unlock Kurdish oil exports, all failed to offset the negative sentiment surrounding the macroeconomic scenario. In reaction to the precipitous plunge in oil prices this week, OPEC+ has confirmed that it will hold its policy meeting on June 4 in person in Vienna, which possibly hints at further tightening of production targets as the previous pledges ran out of steam.

Natural Gas

For the report week beginning Wednesday, April 26, and ending Wednesday, May 3, 2023, the Henry Hub spot price fell by $0.16 from $2.19 per million British thermal units (MMBtu) at the week’s start to $2.03/MMBtu by the week’s end. The May 2023 NYMEX contract expired on April 26 at $2.117/MMBtu. The June 2023 NYMEX contract price decreased to $2.170/MMBtu, down by $0.14 from the beginning of the week to the end of the report week. The price of the 12-month strip averaging June 2023 through May 2024 futures contracts declined by $0.10 to $2.942/MMBtu.

International natural gas futures prices decreased this report week. Weekly average front-month futures prices for liquefied natural gas (LNG) cargoes in East Asia fell by $0.36 to a weekly average of $11.54/MMBtu. Natural gas futures for delivery at the Title Transfer Facility (TTF) in the Netherlands, the most liquid natural gas market in Europe, fell by $0.52 to a weekly average of $12.32/MMBtu. In the corresponding week last year (the week from April 27 to May 4, 2022), the prices were $24.08/MMBtu and $30.90/MMBtu in East Asia and at the TTF, respectively.

World Markets

European stocks ended the week marginally lower on the back of continued concerns about rising inflation rates and its likely impact on continued monetary policy tightening. There were also fears of a recession and the possibility of a banking contagion. The pan-European STOXX Europe 600 Index closed 0.28% lower over the past week’s trading. The major stock indexes were mixed, with Germany’s DAX up by 0.24% and France’s CAC 40 Index down by 0.78%. The UK’s FTSE 100 Index lost by 1.17%. European government bonds declined following the raising of interest rates by the European Central Bank (ECB) by 0.25%, scaling back from the previous 0.50% rate hike. The yield on the benchmark 10-year German government debt slowed to almost one-month lows. Yields in the UK were broadly unchanged, remaining close to one-month peaks at about 3.8% while investors anticipated more policy tightening from the Bank of England. Meanwhile, inflation in the eurozone advanced to 7.0% year-over-year in April, from the March figure of 6.9%. Core inflation (excluding food, energy, alcohol, and tobacco) nevertheless ticked down from a record level to 5.6%. The labor market tightened with the jobless rate falling to 6.5%. Germany’s jobless rate was the lowest among the bloc members at 2.8%.

Japan’s stock markets advanced for the first two days of the week and remained closed for the next days to the weekend due to the Golden Week national holidays. The Nikkei 225 Index returned 1.0% and the broader TOPIX Index climbed by 0.9%. The markets rallied on Monday due largely to a sell-off in the yen that boosted the outlook for Japan’s exporters. This followed the Bank of Japan’s (BoJ’s) decision to maintain its ultra-easy monetary policy stance during its April 27-28 meeting. Over the full week, however, the yen strengthened to around JPY 134.1 to the US dollar, from about JPY 136.3 to the greenback. A safe-haven demand supported the Japanese currency amid U.S. recession concerns and continued fears about the health of certain U.S. regional banks. Speculation was also fueled by the Fed’s signaling a pause in its interest rate hiking cycle. The yield on the 10-year Japanese government bond remained broadly unchanged at 0.42%.

Chinese equities closed the week mixed after a holiday-shortened week as sentiments were tempered by the release of surprisingly weak manufacturing data. The Shanghai Stock Exchange Index gained by 0.34% while the blue-chip CSI 300 fell 0.3% in local currency terms. Financial markets in mainland China were closed from Monday through Wednesday for the Labor Day holiday. China’s official manufacturing purchasing managers’ index (PMI) weakened from 51.9 in March to 49.2 in April, with 50 marking the border between contraction and growth. This marks a return to contraction for the first time since December when Beijing abandoned its zero-COVID policy. The nonmanufacturing PMI likewise softened in April albeit remaining in the expansionary territory above 50. Domestic tourism during the five-day holiday rebounded to pre-pandemic levels, increasing by 71% from a year earlier. Spending activity surged by 129% year-over-year, fueling optimism that a sustained recovery in the services sector may help offset the manufacturing sector’s weakness and a fragile property market recovery.

The Week Ahead

Next week, the important economic data scheduled for release include hourly earnings growth and the CPI and PPI indexes.

Key Topics to Watch

  • Wholesale inventories
  • Chicago Fed President Goolsbee television interview
  • Fed Senior Loan Survey
  • Fed Gov. Philip Jefferson speaks
  • New York Fed President Williams speaks
  • Consumer price index
  • Core CPI
  • CPI year over year
  • Core CPI year over year
  • Producer price index
  • Core PPI
  • PPI year over year
  • Core PPI year over year
  • Initial jobless claims
  • Continuing jobless claims
  • Fed Gov. Christopher Waller speaks
  • Import price index
  • Import price index minus fuel
  • Consumer sentiment (preliminary)
  • St. Louis Fed President Bullard and Fed Gov. Jefferson on panel on outlook for economy and monetary policy

Markets Index Wrap Up

Weekly Market Review – April 29, 2023

Stock Markets

Major stock market indexes were mixed this week. The Dow Jones Industrial Average (DJIA) was up marginally by 0.86% week-on-week, mirroring the Total Stock Market index increase of 0.58%. The S&P 500 Index was on pace with the DJIA as it gained by 0.87% for the week, although the Nasdaq Stock Market Composite performed better with a 1.28% climb. The NYSE Composite moved sideways with a slight dip of 0.21%. CBOE Volatility, an indicator of investors’ perceived risk, declined by 5.90%. Trading for the week was selective as only four stocks – Microsoft, Apple, Amazon.com. and Facebook parent Meta Platforms – accounted for almost half of the strong gain of the S&P 500, its strongest since January 6. Unfortunately, cyclical sectors mostly performed poorly as investors discounted several new signs of an economic slowdown, particularly in the manufacturing sector.

Looking at the stock market’s performance year-to-date, there is still much to be optimistic about. This week added to the year’s gains so far, including a 2% rally on Thursday, the best day since January 6. The S&P 500 is up by 8%, while the Nasdaq has seen the strongest momentum with a 16% gain as technology and growth stocks rallied on the back of lower rates. Global markets have also surged as international developed-market equities moved up 11% year-to-date. Bonds likewise participated in the rebound, with yields pulling back from the last year’s peak and returning 3%.

U.S. Economy

Early in the week, several indicators of regional manufacturing activity came in well below expectations and suggested that factories were cutting back on production in April. A negative outlook was noted for shipping volumes from United Parcel Service, which lost 10% of its stock price on the news. Durable goods data released on Wednesday surprised on the upside as it rose by 3.2% in March orders. The optimism is tempered, however, by the fact that orders excluding aircraft and defense, considered a better indicator of business spending plans, dipped by 0.4%. Retail inventories rose by 0.4% for the month, which is more than expected and the most since August, suggesting the need for further cutbacks in production and spending.

The Commerce Department’s advance estimate of annualized growth in gross domestic product (GDP) in the first quarter was released on Thursday, coming in at 1.1% which is well below the consensus estimate of 2%. The GDP report signals a softening economy, nevertheless, it also confirms that the movement is gradual rather than abrupt, suggesting that a mild and shallow recession, rather than a precipitous drop, is ahead. This outlook appears to be bolstered by a labor market that is in a historically healthy position, allowing consumers to deal with a recession in better shape. The latest data suggests that employment conditions are weakening, but moderately, which contributes to softening the effect of a coming market slowdown.

Fears of a slowdown and possible recession were further escalated by renewed turmoil in the banking industry. U.S. markets ended on session lows on Tuesday following the earnings release by California’s First Republic Bank. The report revealed that the bank had suffered more than $100 billion in deposit outflows in the first quarter. The news plunged the bank’s stock price by almost half and influenced the performance of the overall regional banking sector. On Friday morning, news came that the Federal Deposit Insurance Corporation (FDIC) was planning on taking the bank into receivership that evening, sending the bank’s stock even lower.

Metals and Mining

Gold prices appear to be stuck in neutral at $2,000 an ounce, which is not necessarily a disadvantage at this point. Precious metals may not be going anywhere for the time being as stubborn inflation continues to compel the Federal Reserve to raise rates and maintain aggressive policies. However, looking back at where gold has been, it appears that the yellow metal is performing exceptionally well. Gold is maintaining a steady grip on $2,000 an ounce as investors prepare to close the books in April. This signifies that it has once more managed an all-time high monthly close at $1,997 an ounce. The prices are well north of a post-pandemic three-year average of approximately $1,807.65 an ounce. At the same time, the gold price is far above the five-year pre-pandemic average of about $1,267.57 an ounce.

As of this past trading week, gold gained by 0.35% from its previous week’s close at $1,983.06            to its latest close at $1,990.00 per troy ounce. Silver slipped by 0.12% from the prior week’s ending at $25.08 to this week’s ending at $25.05 per troy ounce. Platinum lost 4.34% of its closing price from the previous week’s $1,127.20 to this week’s $1,078.31 per troy ounce. Palladium also declined from its previous closing price of $1,605.10 to this week’s closing price of $1,506.87 per troy ounce, a loss of 6.12%.  The three-month LME prices for base metals mostly ended the week on the downside. Copper came from $8,794.50 a week ago and lost by 2.26% to end this week at $8,595.50 per metric tonne. Zinc, which closed one week ago at $2,719.00, ended this week at $2,647.50 per metric tonne for a loss of 2.63%.  Aluminum, which one week ago ended at $2,396.50, lost by 1.69% to end this week at $2,356.00 per metric tonne. Tin ended this week at $26,088.00 per metric tonne, a decline of 1.90% from last week’s close at $26,594.00.

Energy and Oil

After Wednesday’s double whammy of bad macroeconomic data, oil prices have stabilized at $78 per barrel for ICE Brent and $74 per barrel for WTI. Fears that economic growth is slowing down in the United States are bolstered by the decline in U.S. capital goods spending. Refinery margins likewise continued their descent this week, making it much harder for downstream players to stay profitable. On the back of these developments and despite the OPEC+ production cuts, oil is poised to see its sixth straight monthly loss.

In other developments this week, OPEC Secretary General Haitham al-Ghais issued a warning to the International Energy Agency (IEA) to exercise caution regarding discouraging investment into oil and gas. Advocating for such measures and finger-pointing at oil producers may lead to increased volatility in the future, al-Ghais argued.

Natural Gas

European natural gas storage inventories as of April 1, 2023, were 56% full. According to data from Gas Storage Europe’s Aggregated Gas Storage Inventory, this is the highest level on record for the end of the heating season. An exceptionally warm winter reduced heating demand, resulting in Europe’s high levels of natural gas in storage. Lower natural gas consumption resulting from a Europe-wide effort to conserve natural gas, as well as record levels of liquefied natural gas (LNG) imports, also contributed to the higher levels and offset lower imports by pipeline from Russia. The U.S. remained the largest LNG supplier to Europe for the second year in a row, accounting for 44% of total LNG imports during 2022.

For this report week beginning Wednesday, April 19, and ending Wednesday, April 26, 2023, the Henry Hub spot price fell by $0.01 from $2.20 per million British thermal units (MMBtu) at the start of the week to $2.19/MMBtu by the week’s end. The May 2023 NYMEX contract expired on April 26 at $2.117/MMBtu, down by $0.11 from one week earlier. The June 2023 NYMEX contract price decreased to $2.305/MMBtu, down by $0.09 throughout the week. The price of the 12-month stripping averaging June 2023 to May 2024 futures contracts declined by $0.04 to $3.042/MMBtu.

International natural gas futures prices declined for this report week. The weekly average front-month futures prices for LNG cargoes in East Asia fell by $0.66 to a weekly average of $11.90/MMBtu. Natural gas futures for delivery at the Title Transfer Facility (TTF), the most liquid natural gas market in Europe, fell by $0.51 to a weekly average of $12.84/MMBtu. In the corresponding week last year (the week from April 20 to 27, 2022), the prices were $25.26/MMBtu and $31.29/MMBtu in East Asia and at the TTF, respectively.

World Markets

European stock markets trekked lower on heightened concerns that the rounds of interest rate increases may finally tip the economy into a recession. The pan-European STOXX Europe 600 Index closed the week lower by 0.50% in local currency terms. The major stock indexes were mixed to lower. Italy’s FTSE MIB declined by 2.41% while France’s CAC 40 Index dipped by 1.13%. Germany’s DAX, on the other hand, advanced by 0.26%. The UK’s FTSE 100 Index gave up 0.55%.  Core eurozone bonds were highly volatile for the week. Resurrected concerns about the U.S. banking industry and an unexpected fall in Spanish producer price inflation initially pushed the 10-year German bund yield lower. Around midweek, however, it corrected upward on the back of the U.S. core personal consumption expenditures inflation that surprised on the upside. Thereafter, news of stagnating first-quarter German economic growth and a more dovish-than-expected Bank of Japan (BoJ) policy meeting on Friday resulted in a pullback in yields. Peripheral eurozone and UK government bonds broadly followed the trend set by core markets.

Japan’s equities markets ascended over the week. The Nikkei 225 Index rose by 1.02% while the broader TOPIX Index gained by 1.10%. A dovish BoJ surprised the markets by signaling a continued commitment to its ultra-loose stance by leaving monetary policy unchanged, including its yield curve control framework. Also contributing to the positive investor sentiment was the government’s easing of Japan’s border controls ahead of an expected increase in arrivals, particularly from China, due to the Golden Week holidays scheduled at the end of April and the beginning of May. Largely due to an unexpectedly dovish BoJ, the yield on the 10-year Japanese government bond (JGB) dipped to 0.41% from 0.46% at the end of the previous week. The yen pulled back to about JPY 135 against the U.S. dollar, from around JPY 134 to the greenback during the prior week, which further signaled policy continuity.

China’s stock markets ended mixed ahead of a five-day holiday. Beijing reaffirmed its commitment to a supportive policy stance, easing worries about an uneven economic recovery. The Shanghai Stock Exchange Index rose by 0.67%, while the blue-chip CSI 300 retreated by 0.09% in local currency terms. China’s stock markets will remain closed for the coming Monday through Wednesday in celebration of the Labor Day holiday. Trading will resume on Thursday, May 4. The country’s top decision-making body, the Chinese Politburo, promised to continue its “forceful” fiscal and monetary policy position to support the economy which is expected to face obstacles in economic transformation and insufficient domestic demand. In this year’s first quarter, China’s economy expanded at its fastest pace in a year. Nevertheless, policymakers remain cautious in light of headwinds ranging from high youth unemployment and slowing global growth.

The Week Ahead

Among the important economic data scheduled for release this week are several labor market indicators (e.g., employment reports and unemployment rate) as well as the Federal Reserve interest rate statement.

Key Topics to Watch

  • S&P U.S. manufacturing PMI
  • ISM manufacturing
  • Construction spending
  • U.S. job openings
  • Factory orders
  • ADP employment
  • S&P U.S. services PMI
  • ISM services
  • Federal Reserve interest rate statement
  • Fed Chair Powell press conference
  • U.S. productivity
  • U.S. trade deficit
  • Initial jobless claims
  • Continuing jobless claims
  • U.S. employment report
  • U.S. unemployment rate
  • U.S. hourly wages
  • Hourly wages year over year
  • Consumer credit

Markets Index Wrap Up

Weekly Market Review – April 22, 2023

Stock Markets

The stock markets moved sideways for the week which was dominated by first-quarter earnings reports and little market-moving economic news. Market volumes were particularly light which underscores the listless trading for the week. First-quarter earnings reports are still coming in, but once the remaining company results have been released, overall earnings for the S&P 500 listed companies will show a decline for the second straight quarter, although some reports have surprised on the upside. During the week, financials outperformed overall despite a quick plunge in Goldman Sachs’s share price after the company missed consensus revenue estimates. Goldman Sachs has diversified into the wealth and asset management businesses.

According to the WSJ weekly markets report, the Dow Jones Industrial Average (DJIA) dipped by 0.23% for the week although the transportation and utility averages and 65 composite inched upward. The total stock market index also slid by 0.05%. The broader S&P 500 Index is likewise down for the week by about 0.10% and the Nasdaq Stock Market Index, which tracks technology stocks, lost by 0.42%.  The NYSE Composite Index corrected by 0.15%. Despite the correction in all the major stock indexes, the CBOE volatility index, a gauge of investors’ risk perception, came down by 1.76%, its lowest level since late 2021.

U.S. Economy

The economy continues to expand, however, there have been recent signals pointing to the inevitable cooling of the labor market and economic activity. The weekly jobless claims report released on Thursday showed signs that the labor market is growing weaker. Investors, however, appear uncertain as to whether this should be treated as good news or bad. If the labor market slows, the Federal Reserve may take this as a sign that inflation is coming under control and, therefore, further interest rate hikes may be dialed back. This would be good news. However, if the slowing labor market was taken as a sign of an impending contraction, the likely prognosis is that a recession is imminent. Then it would be bad news. Weekly claims increased slightly more than expected, but continued claims were elevated significantly more than anticipated and attained their highest level, 1.87 million, since November 2021.

Housing data also projected a weakening of activity, as starts and finishes slowed down from February’s data. Existing home sales descended, while year-over-year home prices lost ground by 0.9%, the largest decrease recorded going back 11 years. The picture painted by S&P Global was more optimistic in their Friday release. According to their analysis, private-sector employers increased hiring in early April at the fastest rate in nine months, while work backlogs grew even while businesses added capacity.  The S&P Global U.S. Composite Purchasing Managers’ Index (PMI) of both services and manufacturing activity rose to its peak in almost a year. The PMI rose to 53.5, with readings over 50 indicating expansion. The strong PMI reading was attributed to stronger demand, improving supply chains, and strength in new orders. The manufacturing PMI was higher than expected and returned to expansion territory with a 50.4 reading for the first time since October.

The yield on the benchmark 10-year U.S. Treasury note surged following the S&P Global data release, reversing earlier declines and ending modestly higher for the week. It should be recalled that bond prices and yields move in opposite directions. The municipal bond market was weighed down somewhat by a spike in supply.

Metals and Mining

Markets have now come to accept the idea that the Federal Reserve will continue to raise interest rates, an issue that caused massive volatility in last month’s trading. At present, the markets have already firmly priced a 25-basis point hike for May, and have pushed back the timing of any potential rate cut to the end of the year. At the height of the banking crisis last month, a potential rate cut was speculated as early as June; as a result, gold prices are ending below $2,000 per ounce this past week due to profit-taking. Gold may see further lows in the short term, although the market remains on track to hit all-time highs within the year.

For the week, precious metals prices were mixed. Gold closed at $1,983.06 per troy ounce, coming down by 1.10% from the previous week’s close at $2,005.21. Silver dipped by 1.22% from its week-ago close at $25.39 to end this week at $25.08 per troy ounce. Platinum, on the other hand, rose by 7.54% from its close the previous week at $1,048.13, to end this week at $1,127.20 per troy ounce. Palladium likewise gained by 6.62% over its week-ago close at $1,505.38 to end this week at $1,605.10 per troy ounce. The three-month LME prices of base metals were likewise mixed. Copper came from its previous week’s close at $9,058.50 to this past week’s close at $8,794.50 per metric tonne, a decline of 2.91%. Zinc lost by 4.16% from its week-ago close at $2,837.00 to this week’s close at 2,719.00 per metric tonne. Aluminum inched upward by 1.25% from the previous week’s close at $2,367.00 to this week’s close at $2,396.50 per metric tonne. Tin climbed by 8.80% from the previous week’s close at $24,442.00 to this week’s close at $26,594.00 per metric tonne.

Energy and Oil

The labor market appears to be cooling, as indicated by an increase in the number of Americans filing for unemployment benefits. This seemed to lull expectations of another interest rate hike from the Federal Reserve which added to the bearish sentiment in the oil markets. A slowing economy signals weaker demand offsetting the falling inventories and adding to fears of dropping oil prices. Macroeconomic-related drivers are expected to dominate in the next two weeks as investors anticipate the Fed and ECB meetings in early May. In the meantime, the Biden administration attempts to allay concerns raised by lawmakers that last year’s 180-million-barrel drawdown of strategic petroleum reserves (SPR) may have damaged the SPR salt caverns.  

Natural Gas

For the report week beginning Wednesday, April 12, and ending Wednesday, April 19, 2023, the Henry Hub spot price fell by $0.01 from $2.21 per million British thermal units (MMBtu) at the start of the week to $2.20/MMBtu at the week’s end. The price of the May 2023 NYMEX contract increased by $0.129 from $2.093/MMBtu to $2.222/MMBtu through the report week. The price of the 12-month strip averaging May 2023 through April 2024 futures contracts climbed by $0.108 to $3.006/MMBtu. International natural gas futures prices decreased during this report week. The weekly average front-month futures prices for liquefied natural gas (LNG) cargoes in East Asia fell by $0.05 to a weekly average of $12.56/MMBtu.  Natural gas futures for delivery at the Title Transfer Facility (TTF) in the Netherlands, the most liquid natural gas market in Europe, fell by $0.48 to a weekly average of $13.35/MMBtu. In the corresponding week last year (the week from April 13 to April 20, 2022), the prices were $27.16/MMBtu and $30.06/MMBtu at East Asia and TTF, respectively.

World Markets

European shares moved sideways for the week on directionless trading in the absence of significant trading incentives. The pan-European STOXX Europe 600 Index gained a modest 0.45% as optimism about the economic outlook gradually picked up versus concerns about interest rates staying higher for a longer period. Major stock indexes were mixed. Germany’s DAX inched up by 0.47% while France’s CAC Index added 0.76%. On the other hand, Italy’s FTSE MIB fell by 0.45%. The UK’s FTSE 100 Index managed to gain by 0.54%. European government bond yields moved higher as investors assessed the chances that the European Central Bank (ECB) will again hike interest rates in May. Eurozone business activity seemed to pick up in April as indicated by a popular Purchasing Managers’ Index (PMI). The Hamburg Commercial Bank (HCOB) Flash Eurozone Composite PMI Output Index, which gauges activity in both the services and manufacturing sectors, rose to 54.4 seasonally adjusted from 53,7 in March, driven by a revival of demand in the services sector. Activity in the manufacturing sector, however, shrank, with the index falling to 48.5 from 50.4, which was likely influenced by protests in France that temporarily slowed output.

Japan’s stock market rose over the past week, with the Nikkei 225 Index coaxed up by 0.25% and the broader TOPIX Index rising by 0.81%. Core consumer price inflation remained above the March 2% target of the Bank of Japan (BoJ). This adds pressure on the BoJ to take steps to normalize monetary policy under its new Governor Kazuo Ueda. The governor reiterated the BoJ’s commitment to its easing stance until price stability is achieved, a message released by Ueda ahead of his first monetary policy meeting at the helm on April 27-28. In this light, the yield on the 10-year Japanese government bond remained unchanged at 0.46%. The yen was also little changed against the dollar, ending the week at JPY 134.

The Chinese stock market fell for the week, as investors’ sentiments were weighed down by mixed economic data and news that the U.S. may introduce fresh investment limits against China. The Shanghai Stock Exchange Index lost by 1.11% while the blue-chip CSI 300 declined by 1.45% in local currency terms. Hong Kong’s benchmark Hang Seng Index gave up 1.78%. China’s year-on-year gross domestic product (GDP) expanded by 4.5%, which was better than expected, in the first quarter of 2023, compared with last year’s growth rate of 3.0%. The recovery was driven by robust export growth and infrastructure investments, as well as a rebound in retail spending and property prices. Based on this growth reading, several banks were prompted to raise their annual growth forecasts for China as consumption continues to recover.

The Week Ahead

Home sales data and inflation measures are among the important economic data coming out in the week ahead.

Key Topics to Watch

  • S&P Case-Shiller home price index (20 cities)
  • FHFA home price index
  • New home sales
  • Consumer confidence
  • Durable goods orders
  • Durable goods minus transportation
  • Advanced U.S. trade balance in goods
  • Advanced retail inventories
  • Advanced wholesale inventories
  • Gross Domestic Product (GDP)
  • Initial jobless claims
  • Continuing jobless claims
  • Pending home sales
  • Employment cost index
  • Personal income (nominal)
  • Personal spending (nominal)
  • PCE index
  • Core PCE Index
  • PCE (year-over-year)
  • Core PCE (year-over-year)
  • Chicago Business Barometer
  • Consumer sentiment (final)

Markets Index Wrap Up

Weekly Market Review – April 15, 2023

Stock Markets

Over the trading week, the benchmark indexes moved slightly higher as investors weighed slowing economic growth signals. The Dow Jones Industrial Average moved up by 1.2% for the week while the total stock market average inched up by 0.89% on the back of a 2.01% gain in the transportation sector that offset a 1.48% slide in the utility average. The broad-based S&P 500 Index also moved up slightly by 0.79% while the technology-heavy Nasdaq Stock Market Composite gained marginally by 0.29%. The NYSE Composite index advanced by 1.45%. The CBOE Volatility Index dropped by 7.23%, indicating a reduction in investor risk perception of the market.  

Materials and industrials shares outperformed within the S&P 500 Index, while technology shares underperformed. The technology sector was weighed partly by a decline in graphics and artificial intelligence chipmaker NVIDIA as it continued on its recent retreat from a 52-week high. Early in the week, trading was exceptionally thin, reflecting the closed markets in Europe following the Easter holiday. Volumes eventually picked up as the week progressed, but trading was muted as investors waited for the release of the quarterly corporate earnings expected to begin on Friday. By the end of the week, analysts expected overall earnings for the S&P 500 to have contracted by 6.5% year-over-year in the first quarter. Earnings in the financial sector were expected to increase moderately. 

U.S. Economy

The Wednesday morning release of the Labor Department’s consumer price index (CPI) for March was highly anticipated by investors and analysts alike. The news that the CPI rose only by 0.1%, slightly below expectations, caused the markets to act positively as it brought the year-over-year inflation rate to 5.0%, the slowest pace since May 2021. The indexes subsequently fell back for the day, which may partly be due to comments from Federal Reserve Bank of Richmond President Thomas Barkin to the effect that “there is still more to do “to calm inflation down. More encouraging news on the producer side was released on Thursday which tended to suggest that consumers could look forward to better prices in the pipeline. The core (excluding food and energy) producer price index dipped by 0.1% in March. This is the first decrease in the prices businesses pay for inputs going back to the height of the pandemic shutdowns in April 2020.

In the meantime, encouraging data on inflation signaled that consumer prices continue to trek a path of moderation after rising to decades-high levels in the past year. As the year progresses, moderating demand and improvement in supply chain disruptions will likely foster lower inflation readings. Moderating inflation and a decelerating economy will possibly provide the conditions for the Federal Reserve to reduce its degree of intervention and move to the sidelines in the coming months, effectively terminating its aggressive rate hike cycle. Although this may not eliminate the economic slowdown, it remains a positive development for the markets since ending monetary tightening is traditionally a favorable economic catalyst.

Bond investors appear to perceive Friday’s data as giving the Federal Reserve some room to life rates further, which resulted in a rise in longer-term U.S. Treasury yields. Technical conditions characterized by relatively lighter dealer inventories and below-average supply continued to support the municipal market. New issuance and trading both remained calm in both the high-yield corporate and the investment-grade bond markets.

Metals and Mining

The past week had been a hectic one for precious metals, but the robust bullish optimism may not be sufficiently sustained as yet to push gold beyond the $2,000 resistance to establish a new all-time high. On Friday, gold started predictably with profit-taking, normally expected after a three-day rally surged gold prices to a new 13-month high above $2,050 per ounce. The profit-taking, however, morphed into a significant retreat as economic data helped to strengthen expectations that the Federal Reserve may continue to raise interest rates by another 0.25% next month. At one point during trading, gold prices slumped by 2% during the session, relinquishing all of its weekly gains. Despite the solid-selling pressure, it is still optimistic to note that gold remained resilient above the $2,000 per ounce support level heading into the weekend.

Over the past week, the spot gold price came from its week-ago level of $2,007.91 to this week’s close at $2,005.21 per troy ounce, losing by a slight 0.13%. Silver gained by 1.64% to end at $25.39 per troy ounce from its prior week’s close at $24.98. Platinum, which closed the previous week at $1,011.80, ended the past week at $1,048.13 per troy ounce for a gain of 3.59%. Palladium closed this week at $1,505.38 per troy ounce, gaining 2.40% from the previous week’s close at $1,470.06.  The three-month LME prices of base metals generally closed up for the week. Copper closed 2.94% higher from its previous week’s price of $8,800.00 to end the week at $9,058.50 per metric tonne. Zinc moved up from its week-ago closing price of $2,779.00 to this week’s closing price of $2,837.00 per metric tonne for a gain of 2.09%. Aluminum began at the previous closing price of $2,333.50 and ended this week at $2,367.00 per metric tonne, higher by 1.44%. Tin closed one week ago at $24,308.00 and this week at $24,442.00, a slight increase of 0.55%.  

Energy and Oil

The bullish optimism that pushed Brent prices north of $87 per barrel, backed mainly by the US CPI figures reported at 5.6%, appeared prepared to slacken just as OPEC reduced its demand forecast for the second semester of 2023. Simultaneously, OPEC retrospectively increased demand in the first quarter, leaving it with the same annual growth as it had previously, at 2.3 million barrels per day. The report of the International Energy Agency (IEA), on the other hand, boosted oil prices on Friday as the agency drew cautious attention to a significant supply deficit later this year. The head of the IEA, Faith Birol, announced that oil markets may see some tightness in the second half of 2023 if the voluntary production cuts of major OPEC+ producers remain in place until the end of the year, thus pushing prices even higher than present levels. The agency warned in its Oil Market Report that a supply deficit, exacerbated by OPEC+ cuts, may adversely impact global economic growth.

Natural Gas

This report week began on Wednesday, April 5, and ended Wednesday, April 12, 2023. The Henry Hub spot price rose by $0.04 from $2.17 per million British thermal units (MMBtu) at the beginning of the week to $2.21/MMBtu by the end of the week. The price of the May 2023 NYMEX contract fell back by $0.062, from $2.155/MMBtu on April 5th to $2.093/MMBtu on April 12th. The price of the 12-month strip averaging May 2023 through April 2024 futures contracts fell by $0.103 to $2.897/MMBtu. International natural gas futures prices decreased throughout the report week. Weekly average front-month futures prices for liquefied natural gas (LNG) cargoes in East Asia fell by $0.35 to a weekly average of $12.61/MMBtu. Natural gas futures for delivery at the Title Transfer Facility (TTF) in the Netherlands, the most liquid natural gas market in Europe, fell by $1.12 to a weekly average of $13.84/MMBtu. In the corresponding week last year, the week ending April 13, 2022, the prices were $33.12/MMBtu and $32.91/MMBtu in East Asia and at the TTF, respectively.

World Markets

European stocks rose as recession fears diminished. The pan-European STOXX Europe 600 Index rose by 1.74% over the trading week ending April 14. Major stock indexes in the region likewise posted gains. Germany’s DAX advanced b 1.34%, Italy’s FTSE MIB gained 2.42%, and France’s CAC 40 Index surged by 2.66%. The UK’s FTSE 100 Index ascended by 1.68%.  Investors weighed the prospects of more policy tightening, resulting in the rise of European government bonds. The yields on 10-year German government debt rose, with some policymakers supporting a half-percentage-point rate increase should the inflation data warrant it. The yields on 10-year UK and French sovereign bonds also climbed.

Japanese equities realized gains over the week. The Nikkei 225 Index increased by 3.54% while the broader TOPIX Index also climbed by 2.71%. Investor sentiment turned optimistic with a comment by prominent investor Warren Buffett that his company, Berkshire Hathaway, would pour more investments into Japan. Also supporting risk assets were dovish comments from the new Bank of Japan (BoJ) Governor Kazuo Ueda and subsequent yen weakness. While Ueda dampened expectations that any sudden major change will take place in monetary policy, he nevertheless signaled that there may be a revision in the central bank’s large-scale easing stance, the consideration of which may take place in the near future. The yen weakened to about JPY 132.5 versus the U.S. dollar, from the previous week’s JPY 132.2. The yield on the 10-year Japanese government bond remained unchanged at 0.46%, on the anticipated continuity of monetary policy under Ueda. The IMF revised its projection for Japan’s 2023 economy downward, from 1.8% to 1.3% in January, due to weak economic performance over the final quarter of last year.

Chinese stocks were mixed at the end of a volatile week, in light of pessimistic consumer sentiment caused by softer-than-expected inflation.  New loans and trade data surprised investors positively, however, it was not sufficient to offset the more serious concerns regarding the strength of the economic recovery. The Shanghai Stock Exchange Index climbed by 0.32% while the blue-chip CSI 300 slipped by 0.76% in local currency terms. In Hong Kong, the benchmark Hang Seng Index ascended by 0.53%. Inflation slowed for the second straight month in March. For this month, China’s consumer price index rose by 0.7% from last year, down from a 1% rise the month before. Core inflation (which excludes food and energy prices, the volatile components) increased to 0.7% in March from 0.6% in February. Following the trend is the producer price index, which receded by 2.5%, the lowest since June 2020 and its sixth straight monthly decline.

The Week Ahead

Included among the important economic data scheduled for release this week are the PMI indexes, leading economic indicators, and the initial and continuing jobless claims.

Key Topics to Watch

  • Empire State manufacturing
  • Home builder confidence index
  • Richmond Fed President Tom Barkin speaks
  • Housing starts
  • Building permits
  • Fed Gov. Michelle Bowman speaks
  • Fed Beige Book
  • New York Fed President Williams speaks
  • Initial jobless claims
  • Continuing jobless claims
  • Philadelphia Fed manufacturing survey
  • Existing home sales
  • U.S. leading economic indicators
  • Fed Gov. Christopher Waller speaks
  • Cleveland Fed President Loretta Mester speaks
  • Dallas Fed listens with Dallas Fed President Lorie Logan and Fed Gov. Michelle Bowman
  • Atlanta Fed President Raphael Bostic speaks
  • S&P flash U.S services PMI
  • S&P flash U.S. manufacturing PMI
  • Fed Gov. Lisa Cook speaks

Markets Index Wrap Up

Weekly Market Review – April 8, 2023

Stock Markets

Last week was marked by light and choppy trading due to a holiday-shortened trading week. U.S. markets were closed on Friday together with most of the other markets in the Americas, in observance of the Good Friday holiday and the Passover that started on Wednesday evening. Also noticeable was a slight pause by investors after the previous week’s end-of-quarter “window dressing.” This is the activity performed by some institutional investors wherein they adjust their holdings in advance of their quarterly public disclosure.

The major indexes were generally up for the week that just ended, although some of their component sectors lost ground. The Dow Jones Industrial Average (DJIA) ascended by 1.91% although its transportation average was down by 1.15%. Nevertheless, the Dow Jones total stock market index was still up by 1.02%. The broad S&P 500 Index also was up by 1.34%, but within this market, the MidCap 400 and SmallCap 600 fell by 0.88% and 0.82% respectively. The technology-heavy Nasdaq Stock Market Composite gained by 0.62% while the NYSE Composite performed slightly better, rising by 1.17% for the week. Predictably, the CBOE Volatility metric slid lower by 3.26%, indicating reducing risk perception among stock investors.

U.S. Economy

Last week, the markets closed early, a bit too soon to react to the nonfarm payrolls report released by the Labor Department for March. On Monday, the Institute for Supply Management’s (ISM’s) gauge of March factory activity reversed a modest uptick in February and descended back to almost its three-year low. The ISM’s gauge for the services sector which was released two days later suggested that the services sector was still expanding, albeit at a rate that was significantly slower than expected. There appears good reason for concerns about a recession to deepen, and hopes for lower interest rates to grow, based on the Labor Department report released on Tuesday. The report indicated that job openings declined much more than expected in February, falling to 9.9 million, a level last reached in May 2021. However, the number of people quitting their jobs grew from 3.9 million to 4.0 million. According to economists, the number of people voluntarily leaving their jobs is a more reliable indicator of the overall health of the labor market.

Pessimistic statements from a Federal Reserve official and a leading bank executive also weighed down investor sentiment. At an economic conference, Cleveland Fed President Loretta Mester disclosed that she expected the federal funds rate to go above 5% and remain at that level, while JPMorgan Chase Chairman and CEO Jamie Dimon warned in a letter to shareholders that the banking crisis is not yet over and “that there will be repercussions from it for years to come.” The weak economic data push U.S. Treasury yields lower, and, since bond prices and yields move in opposite directions, bond prices moved up. Bonds in the energy sector were early outperformers on news of a production cut by OPEC and other oil-producing nations, while U.S. and Yankee banks – banks domiciled in the U.S. but with most of their operations abroad – lagged the broader market.

Overall, it is likely that a soft recession may lie in the future of the U.S. economy, based on three emerging trends. First, the labor market is showing signs of faltering. Second, manufacturing and services activity continues to fall. Third, the housing sector appears to be softening. The most likely scenario is for a mild recession, possibly beginning in mid-2023.

Metals and Mining

There is so much uncertainty dominating the financial markets, as may be testified by comments among financial experts that a recession is likely to materialize in the months to come. In the impending flight to safe-haven assets, gold may experience continued buying pressure. At present, gold has hit a new record high above $2,000 an ounce, and silver is starting to tread at the $25 per ounce level. Gold and silver have significantly benefited from a steep drop in bond yields this past week, which in turn weighs on the U.S. dollar. If the U.S. dollar finds some momentum, it may cause investors to take some profits on their bullish gold positions. Also, even if the U.S. labor market has been surprisingly resilient since early 2022, analysts observe that signs are showing that the tide is starting to shift in the labor market, highlighting weakness and raising fears of a recession. This might usher in further dollar weakness and a corresponding upside for precious metals.

In the week just ended, gold came from its previous close at $1,969.28 to end at $2,007.91 per troy ounce, up by 1.96%. Silver rose by 3.65% from the previous week’s close at $24.10 to this week’s close at $24.98 per troy ounce. Platinum climbed by 1.67% to close this week at $1,011.80 per troy ounce from the earlier week’s close at $995.22. Palladium, which was priced one week ago at $1,463.77, closed this week at $1,470.06 per troy ounce, a gain of 0.43%. The three-month LME prices of base metals all fell over the week. Copper came from $8,993.00 one week ago to settle this week at $8,800.00 per metric tonne, descending by 2.15%. Zinc closed at $2,779.00 per metric tonne this week, lower by 4.91% from the previous week’s price of $2,922.50. Aluminum descended by 3.29% from the previous week’s close at $2,413.00 to this week’s close at $2,333.50 per metric tonne. Tin began at its prior week’s close of $25,835.00 to settle this week at $24,308.00 per metric tonne for a loss of 5.91%.

Energy and Oil

After the surprising rally in oil prices seen at the beginning of this past week, the subsequent increases have been sluggish despite the notable stock draws in both the U.S. crude and product inventories. In light of the resurging U.S. demand after a weak first quarter and OPEC+ showing a resolve to curb production, supply-side factors seem to indicate the existence of a further upside. Simultaneously, macroeconomic concerns might once more cut short what should be an impending bull market, particularly if the U.S. labor market data douse expectations of a resurging economy. It appears that recession fears have begun to weigh on diesel prices, seeing how the premium of diesel against Brent or WTI has been shrinking for the past six months. Diesel’s cyclical sensitivity makes it vulnerable to declines in business activity and lower manufacturing orders.

Natural Gas

For the week starting Wednesday, March 29, and ending Wednesday, April 5, 2023, the Henry Hub spot price rose $0.22 from $1.95 per million British thermal units (MMBtu) at the start of the report week to $2.17/MMBtu by its end. The April 2023 NYMEX contract expired by the week’s end at $1.991/MMBtu. The May 2023 NYMEX contract price decreased to $2.155/MMBtu, down by $0.03 throughout the week. The price of the 12-month strip averaging May 2023 through April 2024 futures contracts declined by $0.08 to $3.000/MMBtu.

International natural gas futures prices increased during this report week. Weekly average front-month futures prices for liquefied natural gas (LNG) cargoes in East Asia rose by $0.24 to a weekly average of $12.96/MMBtu. Natural gas futures for delivery at the Title Transfer Facility (TTF) in the Netherlands, the most liquid natural gas market in Europe, rose by $1.48 to a weekly average of $14.96/MMBtu. In the corresponding week last year (i.e., the week ending April 6, 2022), the prices were $33.99/MMBtu in East Asia and $36.25/MMBtu at the TTF.

World Markets

European shares gained ground as concerns of a deeper banking crisis faded. The pan-European STOXX Europe 600 Index closed the five-day trading week ending April 6 with a 0.90% increase. Major stock indexes were mixed on slow trading. Three European Central Bank (ECB) officials have issued statements over the week hinting at more rate hikes ahead. ECB President Christine Lagarde, Vice President Luis de Guindos, and Chief Economist Philip Lane opined that inflationary pressures necessitate further interest rate hikes in the future. Other policymakers, however, said that while rates may continue to rise, they are also possibly close to their peak. This group includes Bank of France Governor François Villeroy de Galhau, Bank of Lithuania Governor Gediminas Šimkus, and Bank of Greece Governor Yannis Stournaras.

Japanese stocks lost some ground over the shortened trading week. The Nikkei 225 Index fell by 1.9% and the broader TOPIX Index declined by 2.1% through Thursday’s trading. Data have been released that suggested the U.S. economy may be slowing down, which is raising fears that a global recession may take place. Investors also speculate about the potential repercussions of Japan’s recent announcement of export restrictions on certain types of semiconductor manufacturing equipment, particularly on Japan’s relations with China, its largest trading partner. There is also speculation about a possible change in the ultra-loose monetary policy of the Bank of Japan (BoJ) under Governor Kazuo Ueda, who assumed the post on April 9. During the week, a former BoJ official suggested that the central bank could tweak its yield curve control framework without prior warning. On this note, the 10-year Japanese government bond rose to 0.46%, from 0.32% at the end of the previous week, tracking the rise in global bond yields. The yen strengthened to about JPY 131.3 against the U.S. dollar from about JPY 132,8 the prior week.

Chinese stocks gained ground during the holiday-truncated week as a recovery in services activity and the property sector boosted invested sentiment. The Shanghai Stock Exchange Index rose by 1.22% and the blue-chip CSI 300 advanced by 1.13% in local currency terms. Markets in Hong Kong and China were closed on Wednesday in observance of the Qingming Festival, also known as Tomb Sweeping Day, when Chinese people honor their ancestors by cleaning and placing offerings on their tombs. China’s new home sales climbed by 55.7% in March, up from 31.9% in February. Increased demand was due to several stimulus measures that China’s central and local governments implemented at the end of 2022 to drive homebuying sentiment. While sales growth is expected to improve for the rest of 2023, many analysts believe that prospects for China’s property market will remain subdued for the longer term.

The Week Ahead

Among the important economic data to be released in the coming week are several inflation indicators, including CPI, PPI, and their core equivalents.

Key Topics to Watch

  • Wholesale inventories
  • NFIB optimism index
  • Chicago Fed President Goolsbee speaks
  • Philadelphia Fed President Harker speaks
  • Minneapolis Fed President Kashkari speaks
  • Consumer price index
  • Core CPI
  • CPI year over year
  • Core CPI year over year
  • Richmond Fed President Barkin speaks
  • San Francisco Fed President Daly speaks
  • Treasury Budget
  • Minutes of FOMC meeting
  • Producer price index
  • Core PPI
  • PPI year over year
  • Core PPI year over year
  • Initial jobless claims
  • Continuing jobless claims
  • U.S. retail sales
  • Retail sales minus autos
  • Import price index
  • Import prices minus fuel
  • Fed Gov. Waller speaks
  • Industrial production
  • Capacity utilization
  • Business inventories
  • Consumer sentiment

Markets Index Wrap Up

Weekly Market Review – April 1, 2023

Stock Markets

The equities markets ended a positive, albeit volatile, first quarter as weakness in banks was offset by strength in technology stocks. In the week just ended, all major stock indexes posted solid gains, offsetting the losses of the preceding weeks. The Dow Jones Industrial Average ended 3.22% higher and the total stock market ascended by 3.67%. The broad S&P 500 Index rose by 3.48%, the technology-tracking Nasdaq Stock Market climbed by 3.37%, and the NYSE Composite jumped by 4.18%. Risk perception calmed as the CBOE Volatility index lost by 13.98% for the week.

Trading was relatively quiet throughout the week as economic data releases and financial news provided comparatively little motivation for market activity. Small caps outperformed large caps, and value stocks modestly outperformed growth stocks. Making up a significant part of the value indexes are the energy stocks which were boosted by rising oil prices. Rising more than 9% for the week was the U.S. benchmark West Texas Intermediate crude oil which climbed back above the USD 80 per barrel level. For the end of the first quarter of 2023, the technology-heavy Nasdaq Composite surged by more than 16% for the quarter, compared to the broad market S&P 500 Index which climbed by about 7%.  

U.S. Economy

A set of new proposed regulations for mid-size banks – i.e., those with assets between USD 100 billion and USD 250 billion – was released by the Biden administration this week. The proposed changes are likely to align the regulation of mid-size banks with the rules governing the country’s largest banks. The new rules are expected to impose more stringent capital and liquidity requirements. They may also require mid-size banks to pass more frequent stress tests under a wider range of scenarios.

More optimistic news has been released regarding inflation. The U.S. core (excluding food and energy) personal consumption expenditure (PCE) price index for February came in at 4.6%, slightly lower than consensus expectations for 4.7%. The Federal Reserve’s preferred inflation metric is the core PCE. The February 2023 reading was below the recent high of 5.4% reached in February 2022, however, it still exceeds the Fed’s long-term inflation target of 2%. The Commerce Department released its final estimate of fourth-quarter 2022 gross domestic product (GDP) growth, which was revised slightly lower to 2.6%.

The U.S. Treasury yields increased but at a slower rate as the market took a respite from the elevated volatility that dominated it for U.S. government debt since the Silicon Valley Bank’s (SVB’s) sudden collapse triggered concerns that the current banking system crisis will eventually lead to a recession. The difference between two- and ten-year Treasury yields became more negative, with short-term rates increasing more than longer-maturity yields, but the yield curve remained less inverted than in early March.

Metals and Mining

The reasons to be bullish on gold remain solidly in place. Count among these the global banking crisis, an impending recession, persistently higher inflation, and now also the possible demise of the U.S. dollar as the world’s reserve currency, although rumors of the latter may be premature. Still, there is a growing global trend that countries are moving towards a multi-currency financial system. Just this past week, China and Russia have agreed to trade in an internationally recognized yuan, a move that is increasingly gaining traction. For many analysts, gold will continue to be the biggest winner in a multicurrency system as the world diversifies away from the U.S. dollar. In 2022, central banks primarily bought a record 1,136 tonnes of gold to diversify their foreign reserve holdings. Central banks may continue to buy gold en masse even if this year might not set another record. Solid support appears to be created at the $1.900 per ounce level this past month, increasingly convincing investors that “strong hands” are holding the asset and creating real value for it in the market.

This week, gold moved from last week’s close at $1,978.21 to the new close at $1,969.28 per troy ounce, slightly correcting by 0.45%. Silver, which ended a week ago at $23.23, closed this week at $24.10 per troy ounce for a gain of 3.75%. Platinum ended this week at $995.22 per troy ounce, appreciating by 1.11% from its previous week’s close at $984.30. Palladium, which closed one week ago at $1,422.00, gained by 2.94% to close this week at $1,463.77 per troy ounce. The three-month LME prices for base metals were mixed. Copper ended this week at $8,993.00 per metric tonne, a correction of 0.42% from last week’s close at $9,031.00. Zinc, which ended the previous week at $2,907.00, closed this week at $2,922.50 per metric tonne for a gain of 0,53%. Aluminum ended the week at $2,413.00 per metric tonne for a gain of 3.74% over the previous week’s close at $2,326.00. Tin, which ended last week at $24,348.00, closed this week at $25,835.00 per metric tonne for a gain of 6.11%.

Energy and Oil

Continuing to provide the impetus for a major pricing upside for oil prices this week was the ongoing tug-of-war over Kurdistan’s oil exports. This situation threatens some 500,000 barrels per day (b/d) of oil at risk of shut-ins after Iraq ordered a halt to all exports. The huge reduction in U.S. crude inventories, driven by stocks in the Gulf Coast, has pushed the gradual return of ICE Brent to the $80 per barrel mark. New U.S. inflation data may pause or stymie that momentum today in a market that appears to respond more sensitively to sentiment rather than supply and demand fundamentals. In the U.S., an oil and gas activity survey published by the Federal Reserve Bank of Dallas indicates that activity stalled in the first quarter of the year, causing the index to plummet from 30.3 in the fourth quarter of 2022 to 2.1 currently amidst rising field costs, higher interest, and plunging gas prices.

Natural Gas

For the report week beginning Wednesday, March 22, 2023, and ending Wednesday, March 29, 2023, the Henry Hub spot price fell $0.09 from $2.04 per million British thermal units (MMBtu) at the beginning of the week to $1.95/MMBtu at the end of the report week. The April 2023 NYMEX contract expired on March 29 at $1.991/MMBtu, down by $0.18 from the start of the report week. The last time the front-month NYMEX contract settled below $2.00/MMBtu was on September 22, 2020, when it settled at $1.834/MMBtu. The May 2023 NYMEX contract price decreased to $2.184/MMBtu, down by $0.12 from March 22 to 29. The price of the 12-month strip averaging May 2023 through April 2024 futures contracts declined by $0.05 to $3.083/MMBtu.

International gas futures price changes were mixed this report week. Weekly average front-month futures prices for liquefied natural gas (LNG) cargoes in East Asia fell by $0.51 to a weekly average of $12.72/MMBtu.  Natural gas futures for delivery at the Title Transfer Facility (TTF) in the Netherlands, the most liquid natural gas market in Europe, rose by $0.33 to a weekly average of $13.47/MMBtu.  In the corresponding week last year (i.e., the week ending March 30. 2022), the prices were $34.22/MMBtu in East Asia and $35.16/MMBtu at the TTF.

World Markets

European shares rallied from their previous weeks’ slump as concerns of financial instability faded away. The pan-European STOXX Europe 600 Index closed 4.03% higher in local currency terms. Also posting significant gains were the major stock indexes of the region. France’s CAC 40 Index rose by 4.38%, the Swiss Market Index (SMI) gained by 4.41%, Germany’s DAX added 4.49%, and Italy’s FTSE MIB increased by 4.72%. The UK’s FTSE 100 Index climbed by 3.06%. European government bonds broadly ascended as investors weighed the implications of strong core inflation data and hawkish comments from the European Central Bank policymakers. The yields on benchmark 10-year German government bonds inched up. Easing concerns about the global banking sector also up French and Swiss bond yields as demand dwindled for assets generally seen as havens. In the UK, the yields on 10-year government debt rose above 3.5% and closed proximate to that level on heightened expectations of another interest rate hike in May.

Japan’s stock markets climbed over the week. The Nikkei 225 Index gained by 2.40% while the broader TOPIX Index ended up by 2.46%. Investor sentiment grew optimistic as concerns eased about the recent turmoil in the global banking sector. There were also some expectations that the U.S. Federal Reserve may continue to moderate its monetary tightening. Core consumer price inflation in the Tokyo areas slowed for the second straight month in March. Nevertheless, the reading still came in ahead of expectations at 3.2% year-on-year and continued to surpass the Bank of Japan’s (BoJ’s) 2% inflation target. This furthered speculation that the central bank may adjust its ultra-loose monetary policy under incoming Governor Kazuo Ueda, who ascends to office on April 9. On this basis, the yield on the 10-year Japanese government bond (JGB) rose to 0.32%, from 0.29% at the end of the previous week, but remained well below the 0.50% level at which the BoJ caps JGB yields.

Chinese stocks rallied on the back of strong economic data coupled with supportive comments from Beijing, thus boosting confidence in the country’s growth outlook. The Shanghai Stock Exchange Index rose by 0.22% and the blue-chip CSI 300 increased by 0.59% in local currency terms. In Hong Kong, the benchmark Hang Seng Index ascended by 2.43%. The country’s No. 2 official who ascended earlier this month, Premier Li Qiang, reinforced China’s commitment to open its economy and deliver reforms that can stimulate consumption and international business. During a speech delivered at the Boao Forum for Asia, a four-day summit for business and government leaders, Li pledged that China’s recovery would deliver new momentum to the world economy despite challenges in the geopolitical environment.

The Week Ahead

Scheduled for release in the coming week are the important economic reports regarding personal credit and employment and unemployment rates.

Key Topics to Watch

  • St. Louis Fed President Bullard speaks
  • S&P final U.S. manufacturing PMI
  • ISM manufacturing
  • Construction spending
  • Fed Gov. Cook speaks
  • Factory orders
  • Job openings
  • Cleveland Fed President Mester speaks
  • ADP employment
  • U.S. trade balance
  • S&P final U.S. services PMI
  • ISM services
  • Initial jobless claims
  • Continuing jobless claims
  • St. Louis Fed President Bullard speaks
  • U.S. employment report
  • U.S. unemployment report
  • Average hourly wages
  • Average hourly wages (year over year)
  • Consumer credit

Markets Index Wrap Up

Weekly Market Review – March 25, 2023

Stock Markets

The uncertainty in the U.S. regional and global banking system has, in just over two weeks, notably shifted the performance of financial markets and, most likely, the path of the Federal Reserve in its policies moving forward. According to the Wall Street Journal markets data, The major stock market indexes generally recovered over the week to recover the lost ground resulting from the shocks that occurred in the final industry during the preceding weeks. The Dow Jones Industrial Average is up by 1.18% and the total stock market was also ahead by 1.26%, whereas the transportation and utilities sectors underperformance among the other sectors. The S&P 500 Index likewise expanded by 1.39% and the Nasdaq Stock Market Composite advanced by 1.66%. The NYSE Composite gained by 1.09%. The CBOE Volatility Index fell by 14.78%, indicative of a drop in investors’ risk perception. Financials underperformed for a third straight week, however, and the small real estate sector took the brunt of consumer concerns about how stresses in the regional banking system would affect the commercial real market, where regional banks are the major lenders.

The Fed is now constrained to perform a balancing act between navigating the liquidity pool on the one hand and battling inflation with rate increases on the other. The policy-setting body is now compelled to consider pausing its interest-rate-hiking cycle, and the recent tightening in financial conditions resulting from the banking crisis may potentially slow economic activity and cool inflation. Many stock market investors who initially adopted a risk-on sentiment have lately shifted towards more defensive positioning, gravitating towards resilient sectors such as consumer staples, health care, and technology outperforming over the past month. Volatility may continue in the near term as investors shake off the fear and restore confidence in the banking sector, and opportunities may continue to present themselves in both equity and bond markets.  

U.S. Economy

In the past week, the most closely watched event was the conclusion of the Federal Reserve’s policy meeting on Wednesday. The Fed raised official short-term rates by 25 basis points, as was generally expected, and officials may stop raising rates after one more hike in May. Fed Chair Jerome Powell’s post-meeting press conference reflected a change in tone that was driven more by forecast uncertainty rather than a strong conviction that a 5.0% to 5.25% fed funds target range (if a 25 bps rate increase were to be announced in May) would sufficiently restrict inflation to preclude further rate hikes after May. In response to questions, Powell confirmed that rate cuts were not expected this year.

The week’s economic data appeared to indicate that the economy still had significant strength, at least heading into what may be a possible banking crisis. Weekly jobless claims remained close to a five-decade low; meanwhile, last Friday’s release of the S&P Global’s Composite Index of both current services and manufacturing activity jumped from 50.1 to 53.3 (note that readings above 50 indicate expansion). This marks the fastest pace of private sector growth since last May 2022, with new orders moving higher for the first time since September. S&P Global’s chief economist observed that the data were “broadly consistent with the annualized gross domestic product (GDP) growth approaching 2%, painting a far more positive picture of economic resilience” than had been observed during the previous months.

Core capital goods orders, which exclude orders for aircraft and defense and which are often relied upon as an indicator of business investment, were also higher than expected upon their release by the Commerce Department on Friday. Such orders increased in February by 0.2%, beating a consensus estimate that indicated a decline of the same magnitude. The optimistic data provided support that lifted the yield on the benchmark 10-year U.S. Treasury note from a six-month intraday low on Friday morning, although the yield still finished modestly lower for the week.

Metals and Mining

After hitting a one-year high, the precious metals market is seeing some selling pressure as it undergoes some cooling down ahead of the weekend. Gold briefly transcended above $2,000 per ounce and while it has since given way to some correction, there still appears to be further bullish momentum to resume its upward trek. The forecast is for safe-haven demand to continue to provide buying support to move gold prices up. According to financial headlines, the recent banking shocks that have hinted at a further financial crisis are far from over. In Europe, fears of contagion have spread from Switzerland to Germany as Deutsche Bank, the nation’s largest lender, saw its biggest increase in credit default swaps since 2018. Credit default swaps are similar to insurance for investors, and payout if a company defaults on its loans. Before the bailout from UBS, credit default swaps for Credit Suisse ran as high as 1,194 basis points, suggesting that further shocks are still to come. Gold remains an attractive safe-haven asset.

Over the week, gold moved from its previous close at $1,989.25 to this week’s close at $1,978.21 per troy ounce, a slight correction of 0.55%. Silver advanced by 2.79% from its week-ago price of $22.60 to its closing price this week at $23.23 per troy ounce. Platinum moved up slightly from last week’s $978.95 to this week’s $984.30 per troy ounce, a gain of 0.55%. Palladium moved sideways for the week, from what was previously $1,423.30 to its new closing price of $1,422.00 per troy ounce, a slight correction by 0.09%. The three-month LME prices for base metals were generally higher for the week. Copper climbed from last week’s $8,518.00 to this week’s $9,031.00 per metric tonne, a gain of 6.02%. Zinc began at $2,857.50 and ended at $2,907.00 per metric tonne, an increase of 1.73%. Aluminum climbed by 2.58% from $2,267.50 to $2,326.00 per metric tonne. Tin advanced from the previous week at $22,218.00 to this week at $24,348.00 per metric tonne for a gain of 9.59%.

Energy and Oil

Oil prices survived the financial jolts of the previous weeks and have rebounded marginally in the past week. ICE Brent climbed closer to $75 per barrel once more as the perennial bulls began to channel the commodity supercycle again. At the other end is the UN once more publishing yet another report of a “ticking climate bomb.” There were brief hopes that for at least a short amount of time, the price of fuel would once again be ideally determined by supply and demand, but this appears a fleeting prospect as Fed policy may soon influence again the movement of currencies and, again, the price of fuels and energy. In the meantime, as of Tuesday, U.S. crude exports are set for an all-time high this month, with outflows to Europe averaging 2.1 million barrels per day so far. Wide discounts for the WTI benchmark and a significantly lower domestic refining pull continue to incentivize oil producers to export as much as they can. Also in the news are reports that the G7 group is not seeking to revise the $60 per barrel price cap on Russian oil this week, three months after it took effect on December 5. Apparently, there is little appetite among members to introduce any modifications to the policy.

Natural Gas

On news regarding natural gas, the European Commission proposed an extension of gas consumption mandates for EU member states to have gas demand cut by 15% for another 12 months, with the knowledge that natural gas markets remain tight despite the exceptionally warm winter. For the week starting Wednesday, March 15, and ending Wednesday, March 22, 2023, the Henry Hub spot price fell $0.40 from $2.44 per million British thermal units (MMBtu) at the start of the week to $2.04/MMBtu at the week’s end. The price of the April 2023 NYMEX contract decreased by $0.268, from $2.439/MMBtu on March 15 to $2.171/MMBtu on March 22. The price of the 12-month strip averaging April 2023 through March 2024 futures contracts declined by $0.133 to $3.046/MMBtu.

International natural gas futures prices decreased for this report week. The weekly average front-month futures prices for liquefied natural gas (LNG) cargoes in East Asia fell by $0.98 to a weekly average of $13.24/MMBtu. Natural gas futures for delivery at the Title Transfer Facility in the Netherlands, the most liquid natural gas market in Europe, fell by $1.43 to a weekly average of $13.14/MMBtu. In the week last year corresponding to this week, (i.e., the week ending March 23, 2022), the prices were $34.83/MMBtu and $33.81/MMBtu in East Asia and at the TTF, respectively.

World Markets

European equities climbed this week despite weakness in bank stocks. The pan-European STOXX Europe 600 Index closed marginally higher (0.87%), as did the major stock indexes in the region. Italy’s FTSE mib advanced by 1.56%, Frances’ CAC 40 Index climbed by 1.30%, and Germany’s DAX gained by 1.28%. The UK’s FTSE 100 Index ascended by 0.96%. In the STOXX Europe 600 Index, bank stocks once more resumed their sharp decline by the week’s end on unabated concerns surrounding the financial sector. The continued drop reversed any gains made earlier on news that the UBS Group agreed to buy Credit Suisse in a deal brokered by the Swiss authorities. Although there were no specific pronouncements, the focus of investors appeared to have transferred to worries surrounding banks with exposure to commercial real estate.

Japan’s stock markets realized mixed returns for the week. The Nikkei 225 Index gained by 0.19% but the broader TOPIX declined by 0.21%. After the worries created by the developments in the global banking sector over the last weeks. Investor concerns somewhat as the Bank of Japan (BoJ) and four other major central banks announced on March 19 that they were coordinating action to provide liquidity and to ease strains in the global funding markets. The yen gained strength after the U.S. Federal Reserve raised interest rates as expected, but stated that a pause on further hikes is being considered. The yen finished the week at around JPY 130.6 from about $131.8 against the U.S. dollar the week earlier. The yield on the 10-year Japanese government bond remained broadly unchanged at 0.29%. Although Japan’s inflation remains high, price pressures are beginning to ease.

Chinese stock markets gained ground on optimism that the People’s Bank of China (PBOC) will continue to maintain accommodative monetary policies during the current global banking crisis. The Shanghai Stock Exchange Index advanced by 0.46% and the blue-chip CSI 300 gained by 1.72% in local currency terms. Hong Kong’s benchmark Hang Seng Index rose by 2.03%. The PBOC left its benchmark one-year and five-year loan prime rates (LPR) at 3.65% and 4.3%, respectively, for the seventh straight month. The LPRs are based on the interest rates that 18 banks offer their best customers and are published monthly by the PBOC. They are quoted as a spread over the rate on the central bank’s one-year policy loans, known as the medium-term lending facility (MLF). The stance was largely expected after the PBOC left its MLF unchanged the previous week and unexpectedly announced a 25-basis-point cut in the reserve requirement ratio for most banks, suggesting the easing of measures to support the economy.

The Week Ahead

Among the important economic data scheduled for release this week are personal consumption, consumer confidence, and consumer sentiment.

Key Topics to Watch

  • Fed Gov. Jefferson speaks
  • Advanced U.S. trade balance in goods
  • Advanced retail inventories
  • Advanced wholesale inventories
  • S&P Case-Shiller home price index (20 cities)
  • FHFA home price index
  • U.S. consumer confidence
  • Fed Gov. Barr testifies to Senate on banks
  • Pending U.S. home sales
  • Fed Gov. Barr testifies to House on banks
  • GDP (2nd revision)
  • Initial jobless claims
  • Continuing jobless claims
  • Boston Fed President Collins speaks
  • Personal income (nominal)
  • Personal spending (nominal)
  • PCE index
  • Core PCE index
  • PCE (year-over-year)
  • Core PCE (year-over-year)
  • Chicago Business Barometer
  • Consumer sentiment (final)
  • Fed Gov. Waller speaks
  • New York Fed President Williams speaks
  • Fed Gov. Cook speaks  

Markets Index Wrap Up

error: Content is protected !!