
Weekly Market Review – August 6, 2022
Stock Markets
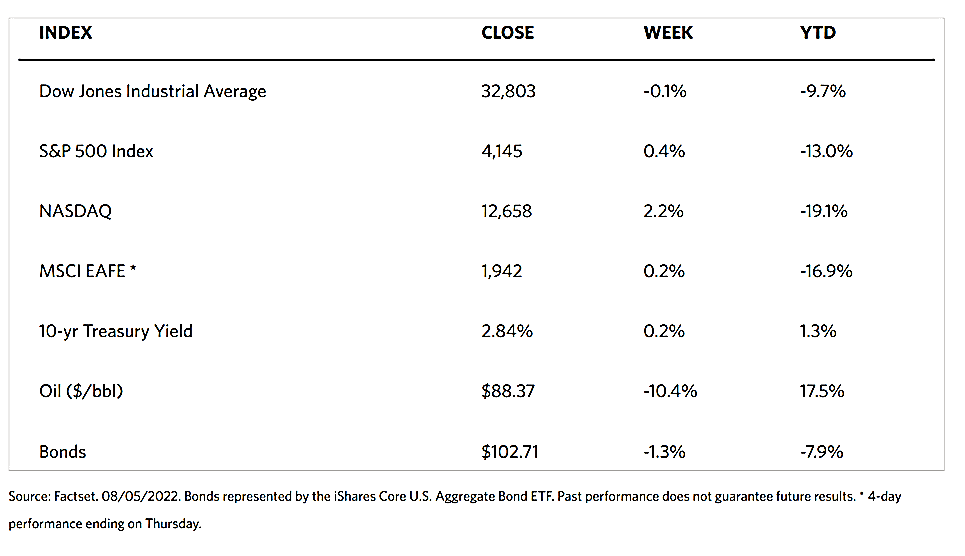
Stocks were mixed throughout trading this past week due to a stronger-than-expected jobs report and renewed investor worries that the Federal Reserve will continue with its aggressive monetary policy. The Dow Jones Industrial Average (DJIA) dipped marginally by 0.13% with all sectors down although the total stock market index rose by 0.67%. Tech stocks did better, as indicated by the 2.15% weekly increase in the Nasdaq Stock Market Composite, while the broad S&P 500 Index recorded an increase of 0.36%. The NYSE Composite was down a slight 0.36%. Trading modestly higher during the week was the broad tax-exempt bond market. It appeared that the strong payroll report and hawkish tone of pronouncements from Fed officials helped drive U.S. Treasury yields higher during the week, outweighing the downward pressure from heightened U.S.-China tensions resulting from House Speaker Nancy Pelosi’s Taiwan visit.
U.S. Economy
The Labor Department’s payrolls report released on Friday showed that 528,000 nonfarm jobs were added in July, more than doubling consensus expectations of 250,000, while estimates for May and June were revised upward by a total of 28,000. The strong July gains have brought total nonfarm employment in the U.S. to its pre-pandemic level. The data suggests that the job market is heating up instead of cooling, which is contrary to the Fed’s intentions to slow growth and, consequently, inflation. The unemployment rate has fallen to its February 2020 level, at 3.5%. Notable hiring increases were accounted for by the leisure and hospitality, professional and business services, and health care sectors. Wage growth rose faster than expected, up 0.5% month-on-month and 5.2% year-on-year. This suggests that inflation may remain elevated in the near term due to wage pressure.
The strong payroll numbers indicate that the Fed has room to raise interest rates further, despite Fed Chair Jerome Powell’s somewhat dovish comments following the central bank’s July 26-27 policy meeting. Initial jobless claims inched up to 260,000 in line with forecasts, while the Institute for Supply Management (ISM) survey data showed an unexpected growth acceleration in the service sector. On the other hand, the ISM’s reading of manufacturing growth exceed expectations but still fell to its lowest level since June 2020.
Metals and Mining
There is not much good news for gold investors that the exceptionally strong jobs report provides. Wages rose more than expected in a contracting economy, which is far from normal. The Fed may decide to increase interest rates more aggressively to seek to control inflation, drawing investments more toward yield-generating assets and away from precious metals that have no yield. Although the next Fed monetary policy decision is still almost two months away, markets have chalked up a 70% chance that the rate will be increased another 75 basis points, whereas before the release of this week’s employment report, this possible movement was estimated at only 30%. Furthermore, the Bank of England hiked its interest rates by 50%, the first half-point movement since the BoE’s independence from the government in 1997. On the other hand, analysts have noted a strong risk premium in the marketplace is providing solid support for gold. The shift in focus was due to the deterioration in U.S.-Sino relations brought about by U.S. House Speaker Nancy Pelosi’s visit to Taiwan. These risks may continue to linger, providing an incentive for investors to remain with gold.
During this past week, the spot price of gold closed at $1,775.50 per troy ounce, 0.54% higher from its prior close at $1,765.94. Silver dipped from its previous closing price of $20.36 to its recent weekly close at $19.90 per troy ounce, a loss of 2.26%. Platinum began at $899.35 and ended the week at $936.26 per troy ounce for a gain of 4.10%. Palladium, which was previously priced at $2,131.10, ended the week at $2,129.29 per troy ounce, down by 0.08%. The three-month outright order price for base metals ended mixed. Copper, which closed at $7,917.50 during the previous week, ended this past week at $7,870.50 per metric tonne, down by 0.59%. Zinc registered a weekly gain of 5.44%, from the prior week’s close at $3,308.50 to last week’s close at $3,488.50. Aluminum fell from the earlier week’s $2,488.50 to last week’s $2,416.00 for a loss of 2.91%. Tin likewise dipped from $25,047.00 the week before to $24,455.00 per metric tonne last week for a decline of 2.36%.
Energy and Oil
Despite the U.S. government’s reluctance to declare that a recession is technically underway, other news and analysis appear to lean to the contrary. The Bank of England issued a warning last week that a five-quarter-long recession is imminent, while the OPEC+ fails to take action on increasing oil production. During its recent meeting to set its collective September 2022 target, OPEC+ agreed to the lowest monthly quota increase since 1986, at 100,000 barrels per day, signifying that the group is still assessing the risk of recession before it takes more radical steps. These signals are taking their toll on oil prices which have fallen back almost to levels before the Russian invasion of Ukraine, with ICE Brent trending around $96 per barrel. For the first time in weeks, oil futures contracts are beginning to reflect expectations of a weak winter as monthly spreads halve week-on-week. While the market remains in backwardation (i.e., when the future prices exceed the spot price), the situation does not appear to be as drastic as it had been before the summer.
Natural Gas
For the report week from July 27 to August 3, 2022, the Henry Hub spot price fell $0.85 from $8.68 per million British thermal units (MMBtu) to $7.83/MMBtu. The price of the September 2022 NYMEX contract descended to $8.266/MMBtu, a decrease of $0.29 for the week. The price of the 12-month strip averaging September 2022 through August 2023 futures contracts slid by $0.20 to $6.748/MMBtu. International natural gas futures prices rose over the report week, with the weekly average futures prices for liquefied natural gas (LNG) cargoes in East Asia rising by $4.61 to a weekly average of $44.57/MMBtu. Also for the report week, natural gas futures for delivery at the Title Transfer Facility (TTF) in the Netherlands, the most liquid natural gas spot market in Europe, increased by $5.90 to a weekly average of $59.54/MMBtu.
World Markets
In Europe, equities weakened on the expectation that central banks will continue to hike interest rates aggressively in an attempt to control inflation. The pan-European STOXX Europe 600 Index slid by 0.59% in local currency terms while major market indexes advanced. France’s CAC 40 Index gained 0.37%, Germany’s DAX Index advanced 0.67%, while Italy’s FTSE MIB Index climbed 0.81%. The UK’s FTSE 100 Index rose 0.22%. Core eurozone government bond yields ended the week sideways. Due to an increase in tensions between the U.S. and China over Speaker Nancy Pelosi’s visit to Taiwan, yields fell early on, only to be driven up again by hawkish pronouncements from Federal Reserve officials ahead of key U.S. data releases. UK yields broadly tracked core markets but ended the week slightly higher after the BoE increased rates by a significant 50 basis points and warned that a recession may be on the horizon. The biggest rate increase in 27 years brought the interest rate to 1.75%. Inflation is projected by the BoE to hit 13.3% by October due to surging energy prices. Inflation will continue to remain “very elevated” throughout 2023 and will recede to its 2% target in two years. The U.K. is forecasted to remain in recession for five quarters beginning this winter.
Japanese equities gained over the past week. The Nikkei 225 Index rose 1.35% while the broader TOPIX Index ascended 0.35%. The impetus was largely pushed by optimistic corporate earnings on the domestic front, although worries about increased friction between the U.S. and China appeared to impose a ceiling on the surge. Japanese firms that earned their revenues from exports benefitted from a weak currency. The yen closed at around JPY 133 against the U.S. dollar for the week, which is broadly unchanged from the past week. The yield on the 10-year Japanese government bond (JGB) slumped to 0.16% the just-concluded week from 0.18% by the end of the previous week as a reflection of the risks of a global recession. A Ministry of Finance official opined that, while nothing yet is conclusive, investors should prepare for a normalization in Japanese bond trading when the Bank of Japan (BoJ) will cease to be the main purchaser of JGBs. Currently, the BoJ’s curve control policy mandate buying an unlimited amount of JGBs to defend an implicit 0.25% ceiling around its zero percent yield target.
Stock markets in China slowed as buyers were pushed to the sidelines by geopolitical tensions, mortgage boycotts, and lukewarm economic data. The broad, capitalization-weighted Shanghai Composite Index slid 0.8% while the blue-chip CSI 300 Index, which follows the largest listed companies in Shanghai and Shenzhen, descended 0.3%. The top issue that moved equities was the trip to Taiwan of U.S. House of Representatives Speaker Nancy Pelosi in the face of Beijing’s protests. The event led to live-fire drills in the waters around Taiwan and imposed sanctions on Pelosi and her immediate family. Shares of Chinese chipmakers surged as speculation grew ripe that the government will increase support for the domestic semiconductor industry coincident with the U.S. ramping up its efforts to curb China’s rise in chip manufacturing.
The Week Ahead
Among the important economic data scheduled for release in the coming week are productivity, jobless claims, and data focusing on inflation in the U.S.
Key Topics to Watch
- NY Fed 3-year inflation expectations
- NFIB small business index
- Productivity
- Unit labor costs
- Consumer price index
- Core CPI
- CPI (year-over-year)
- Core CPI (year-over-year)
- Wholesale inventories (revision)
- Federal budget (compared with year earlier)
- Initial jobless claims
- Continuing jobless claims
- Producer price index
- Import price index
- UMich consumer sentiment index (preliminary)
- UMich 5-year inflation expectations (preliminary)
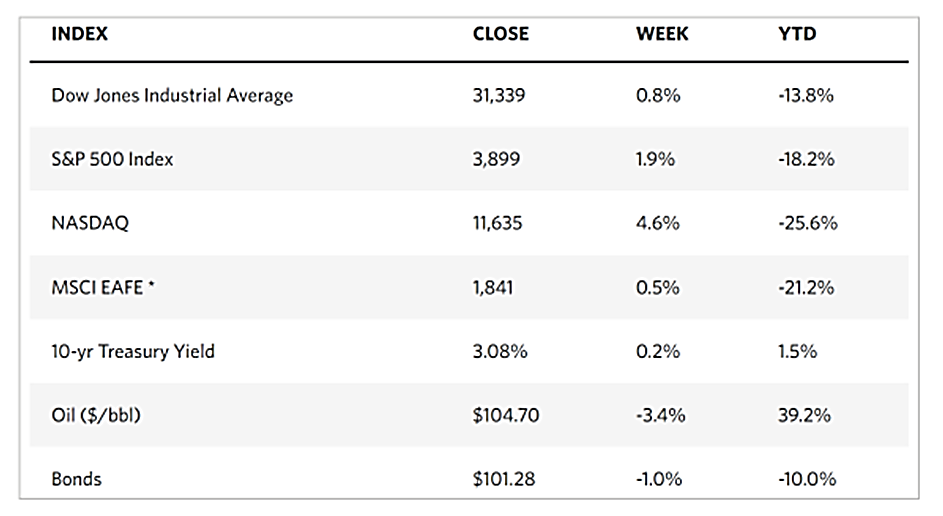
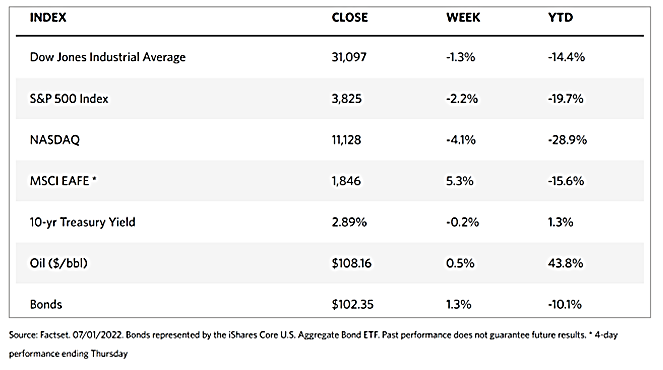
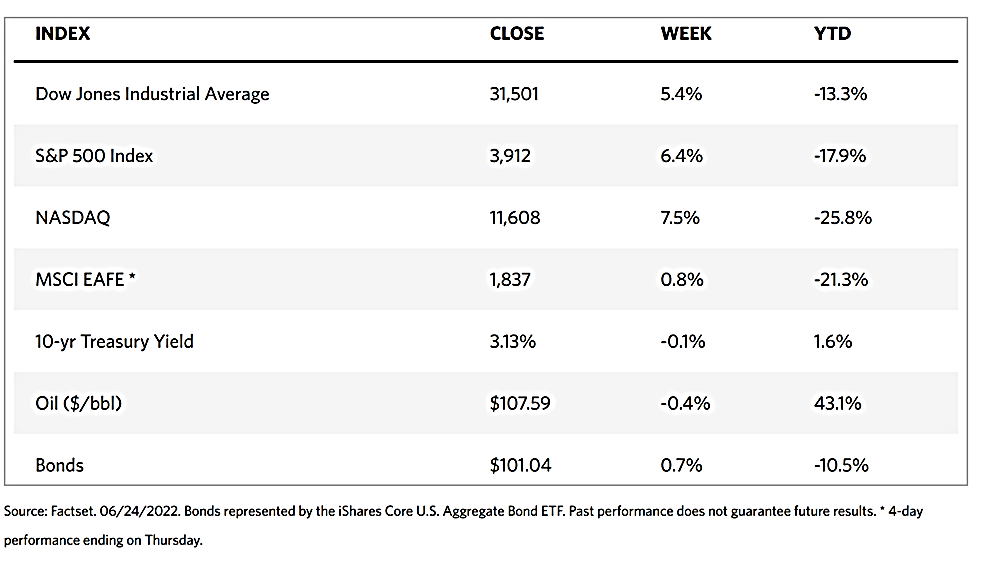
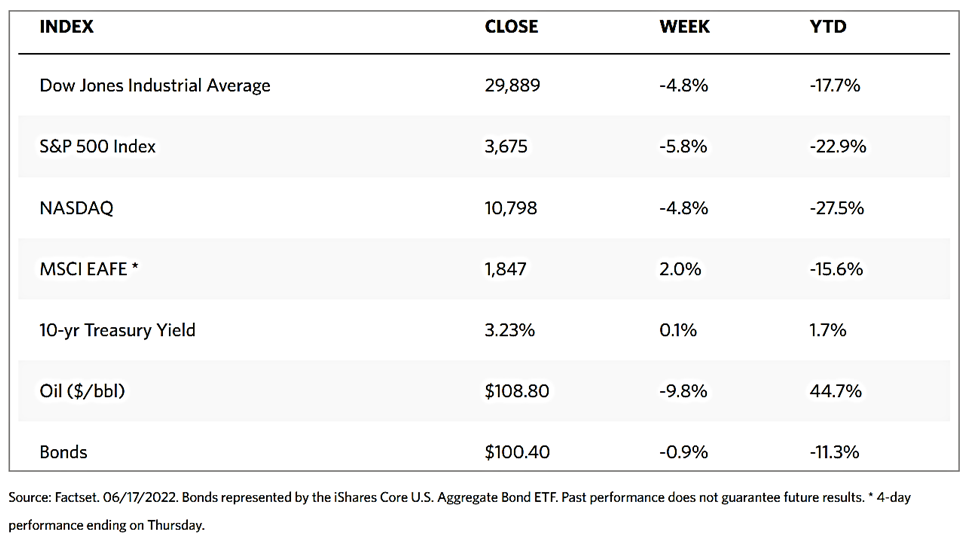
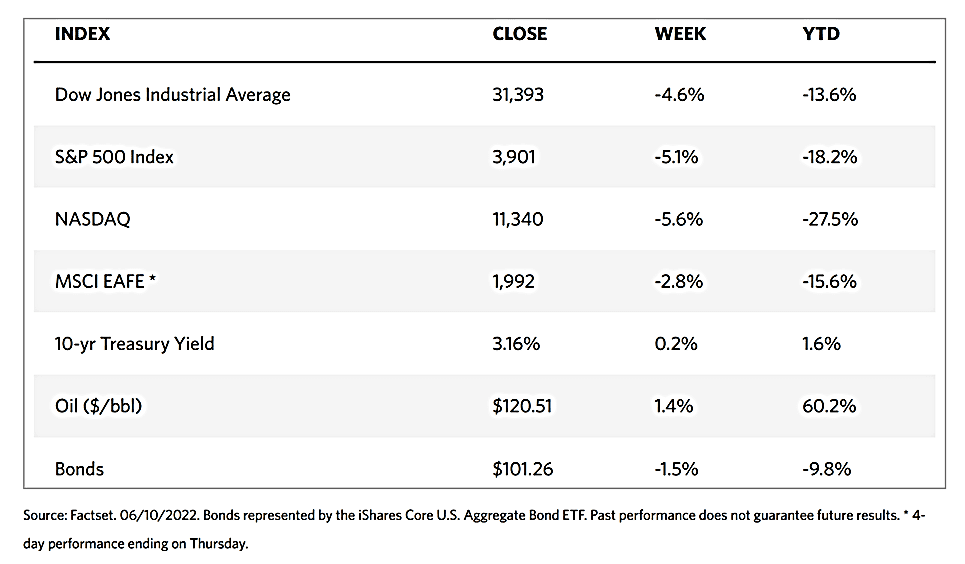
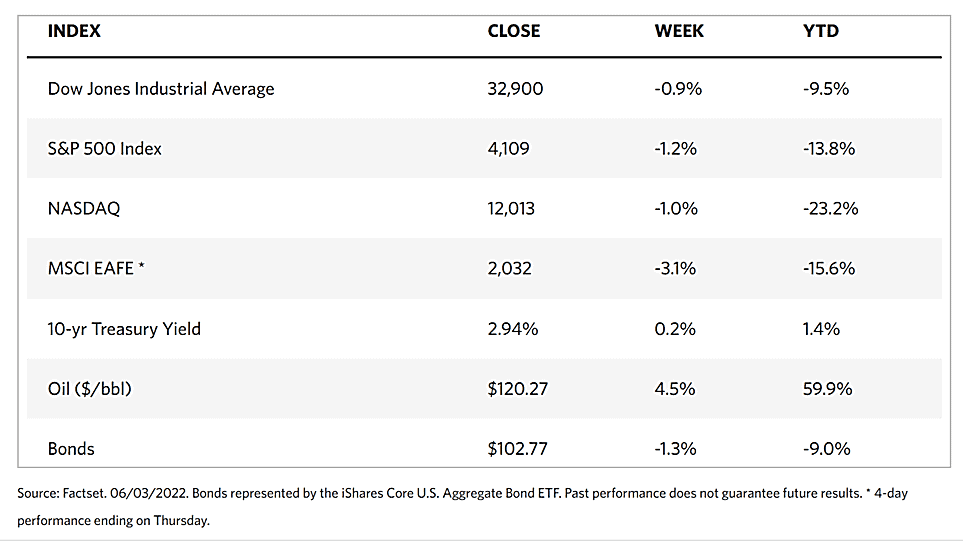
Markets Index Wrap Up