
Weekly Market Review – December 16, 2023
Stock Markets
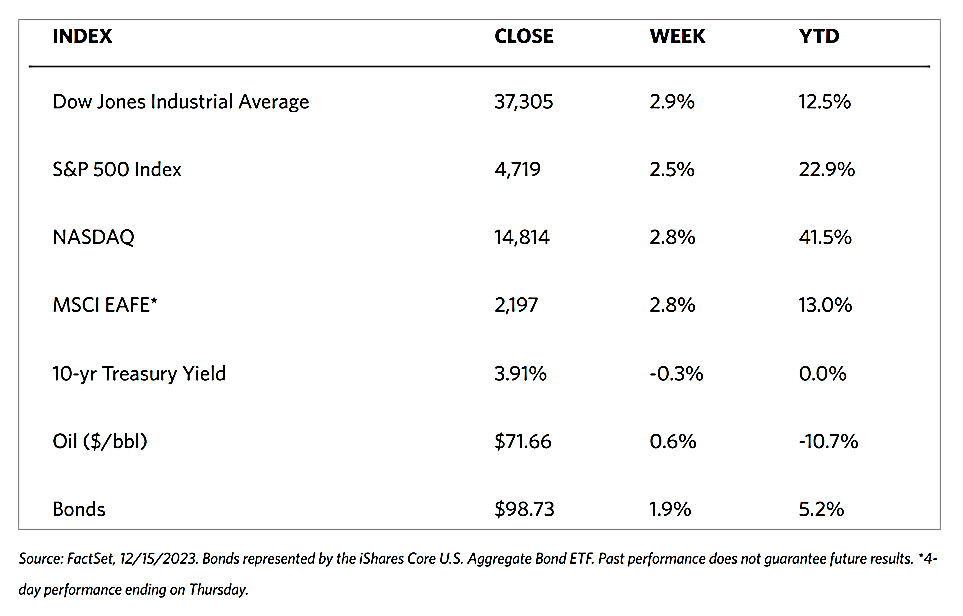
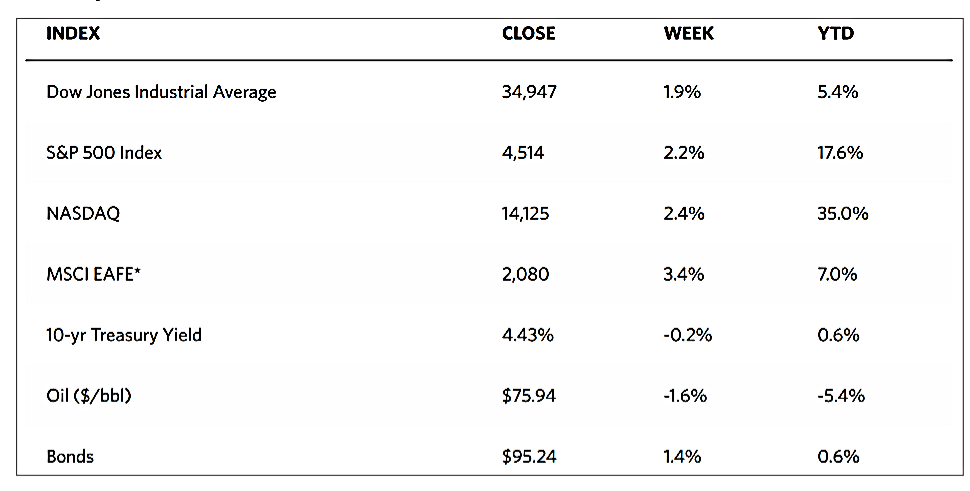
Holiday cheer and the absence of significantly negative news drove the stock markets up for the seventh consecutive week. According to the Wall Street Journal Markets report, the Dow Jones Industrial Average (DJIA) roared upwards by 2.92% for the week as its Total Stock Market Index climbed by 2.85%, suggesting that institutional buying may be driving the purchase of index-linked stocks. The Nasdaq Stock Market Composite, a tracker for technology stocks, also rose by 2.85% while the broad S&P 500 Index ascended by 2.49%. The NYSE Composite Index gained by 2.48% even as the Russell 2000 Index shot up by 5.55% and the Russell 1000 added 2.68%, suggesting that small-cap stocks massively outperformed the large-cap issues. The CBOE Volatility Index (VIX) only moved the needle slightly downward by 0.57%, suggesting that investors perceive risk to have mitigated in the markets and have lowered expectations of market volatility.
The run-up this week lifted the S&P 500 and Nasdaq Composite Indexes to 52-week highs and the DJIA to its all-time peak. The seven weeks of straight gains was the longest streak for the S&P 500 Index since 2017. The week’s gains were also broadly based, as indicated by the equally-weighted index of S&P 500 stocks outpacing by 131 basis points its market-weighted counterpart. The Russell 2000 Index gains for the week lifted it out of bear market territory (a descent of 20% from its peak) for the first time in more than 20 months. Volumes were also elevated at the end of the week as the number of shares exchanging hands daily reached a new high for 2023. Since volume follows the trend, this may be a bullish sign that markets could be ready to move higher.
U.S. Economy
What appears to be incentivizing the rise in market participation among investors is the expectation of a more benign inflation environment among policymakers. On Tuesday, the report released on consumer price inflation was approximately in line with expectations. Core inflation, which excluded food and energy, remained steady at 4.0% year-over-year. The producer price inflation report which was released on Wednesday reported core inflation running at 2.0% for the year, its lowest level since January 2021 and surprising modestly on the downside. While the Federal Reserve left rates unchanged, the quarterly “dot plot” which summarizes individual policymakers’ rate expectations shows that the median projection was for 75 basis points of rate cuts, up from 50 basis points in previous projections, coming in 2024.
Another indicator was the retail sales data released on Thursday which arguably disrupted the disinflation narrative, but investors appeared to generally discount the data and take it in stride. Retail sales rose by 0.3% unexpectedly in November while October’s decline was revised lower. This reflects a strong start to the holiday shopping season. Particularly strong were online sales and sales at restaurants, which shows a resilience in discretionary spending. However, other data released during the week point to some surprising weakness in the manufacturing sector. Overall, the Fed forecasts a form of soft landing with a steady unemployment rate of 4.1% despite lower growth and inflation for 2024. The soft-landing recession expected signifies that there will likely be cooler economic growth and moderating inflation without a meaningful decline in joblessness.
Metals and Mining
The Federal Reserve will continue to drive gold prices, according to the broadest consensus among analysts. With the Fed Funds rate at its peak, however, the only trend possible is downwards, leaving only the question of when and how fast the decline will be. The Fed signaled in its updated economic projections on Wednesday that it sees the potential for three rate cuts in 2024 – the first clear signal that the committee is ready to pivot in its interest rate direction, which will be a positive development for gold prices. In the past year, precious metals were able to withstand the Fed’s most aggressive hiking cycle in more than four decades. The $1,800 per ounce level proved to be a major support for gold despite the rising yields. As headwinds start to dissipate, the implications for the yellow metal could be bullish.
The spot prices of precious metals this week saw significant gains. Gold rose by 0.75% from its previous weekly close at $2,004.67 to this week’s closing price of $2,019.62 per troy ounce despite treading close to new highs. Silver ascended by 3.74% from last week’s close at $23.00 to this week’s close at $23.86 per troy ounce. Platinum’s weekly close saw a 2.59% elevation from last week’s price of $920.65 to this week’s price of $944.51 per troy ounce. Palladium ascended by 24.33% from last week’s closing price of $946.74 to this week’s closing price of $1,177.06 per troy ounce. The three-month LME prices of base metals also climbed this week. Copper rose by 2.48% this week from its last weekly closing price of $8,342.00 to this week’s closing price of $8,549.00 per metric ton. Zinc ascended by 5.22% from last week’s close of $2,406.50 on its way to this week’s close of $2,532.00 per metric ton. Aluminum gained by 5.39% from last week’s $2,132.50 price to this week’s $2,247.50 per metric ton close. Tin inclined by 2.03% from last week’s closing price of $24,675.00 to this week’s closing price of $25,175.00 per metric ton.
Energy and Oil
At last, the oil markets are on track for its first week-ion-week increase in eight weeks, with the price of Brent rising toward $77 per barrel. The United States accounted for much of the bullish sentiment, despite continuous attacks on tankers in the Red Sea. The first reason is the Federal Reserve’s pledge to start cutting interest rates in the coming year, an announcement that drove the markets in general due to positive investor sentiment. The second reason is the larger-than-expected U.S. inventory draw which pushed oil prices further up. For now, the Brent decline down to the low 70s is off the table, but the question remains as to how long. In the December monthly oil report released this week, the OPEC reiterated that it is optimistic for robust oil demand growth in 2024, by as much as 2.46 million barrels per day (b/d). It oil producers’ group blamed the recent plummet in oil prices on exaggerated oil demand concerns that negatively and disproportionately impacted market sentiment.
Natural Gas
For the report week beginning Wednesday, December 6, and ending Wednesday, December 13, 2023, the Henry Hub spot price fell by $0.40 from $2.73 per million British thermal units (MMBtu) to $2.33/MMBtu. Natural gas spot prices fell at most locations this report week, mostly in line with the U.S. benchmark Henry Hub price. Price changes ranged from a decrease of $6.41/MMBtu at Algonquin Citygate to an increase of $1.23/MMBtu at the Waha Hub.
Regarding the Henry Hub futures, the price of the January 2024 NYMEX contract decreased by $0.234, from $2.569/MMBtu at the start of the week to $2.335/MMBtu by the end of the report week. The price of the 12-month strip averaging January 2024 through December 2024 futures contracts declined by $0.183 to $2.563/MMBtu.
International natural gas futures prices decreased this report week. The weekly average front-month futures prices for liquefied natural gas (LNG) cargoes in East Asia decreased by $0.33 to a weekly average of $15.77/MMBtu. Natural gas futures for delivery at the Title Transfer Facility (TTF) in the Netherlands, the most liquid natural gas market in Europe, decreased by $1.18 to a weekly average of $11.73/MMBtu. During the week last year that corresponds to this report week (beginning December 7 and ending December 14, 2022), the prices were $33.46/MMBtu in East Asia and $42.46/MMBtu at the TTF.
World Markets
On the back of expectations that the central banks may eventually reverse its rate hiking policy, European equities reflected investors’ increasing optimism. The pan-European STOXX 600 Index closed higher by 0.92% for the week in local currency terms as financial markets increasingly expect to cut interest rates in 2024. The major stock indexes in the region ended mixed. France’s CAC 40 Index gained 0.93%. Ending modestly lower were Germany’s DAX and Italy’s FTSE MIB. The UK’s FTSE 100 Index inched upward by 0.29%. The European Central Bank maintained its key deposit rate at a record high of 4.0% but it cut its inflation and growth forecasts for 2023 and 2024. In December, business activity in the Eurozone shrank, according to a report by S&P Global. An early estimate of the Purchasing Managers’ Index (PMI) based on the combined output of the manufacturing and services sectors fell to 47.0 from 48.6 in November. This is a two-month low and a seventh straight month of contraction, indicated by a rating below 50.
Japan’s stock markets ascended over the week. The Nikkei 225 Index gained 2.1% while the broader TOPIX Index rose by 0.3%. The buy-up was spurred by the U.S. Federal Reserve signaling by the clearest indications so far that it will pivot away from monetary policy tightening, holding interest rates steady, and projecting more aggressive rate cuts in 2024. However, the yen strengthened somewhat, creating disadvantages for Japan’s exporters. The yield on the 10-year Japanese government bond (JGB) fell from 0.77% to 0.70% over the week due to speculation waning that the Bank of Japan (BoJ) is likely to end its negative interest rate policy sooner than expected, a reaction to the Fed’s pivot. The yen reacted by strengthening to the JPY 141 level against the dollar from the high range of JPY 144 during the previous week. Much of the currency’s strength is due to expectations about narrowing U.S.-Japan interest-rate differentials.
Chinese equities slid due to persistent deflationary pressures that weighed on the country’s economic outlook. The Shanghai Composite Index declined by 0.91% while the blue-chip CSI 300 slipped by 1.7% over the past week. The Hong Kong benchmark Hang Seng Index rose by 2.8% amid the global stock rally in response to the Fed keeping interest rates unchanged and signaling rate reductions in 2024. China’s consumer price index dipped in November by 0.5% year-on-year, higher than October’s 0.2% contraction. It is also the steepest drop since November 2020 as lower pork prices brought food prices lower. In the meantime, the producer price index fell by 3% from last year, a figure bigger than expected and its 14th straight month of decline. The circumstances point to potential deflation which is problematic for China. According to economists, it could trigger a downward spiral of economic activity.
The Week Ahead
Scheduled for report this coming week are PCE inflation data, home sales data, and retail sales data for November, among others.
Key Topics to Watch
- Consumer Price Index (CPI) for November
- Core CPI for November
- CPI year-over-year
- Core CPI year-over-year
- Monthly U.S. federal budget for November
- Producer price index (PPI) for November
- Core PPI for November
- PPI year-over-year
- Core PPI year-over-year
- FOMC interest rate decision
- Fed Chairman Jerome Powell press conference
- Initial jobless claims for December 9
- Import price index for November
- Import price index minus fuel for November
- U.S. retail sales for November
- Retail sales minus auto for November
- Business inventories for November
- Empire State manufacturing survey for December
- New York Fed President John Williams speaks
- Industrial production for November
- Capacity utilization for November
- S&P flash U.S. services PMI for December
- S&P flash U.S. manufacturing PMI for December
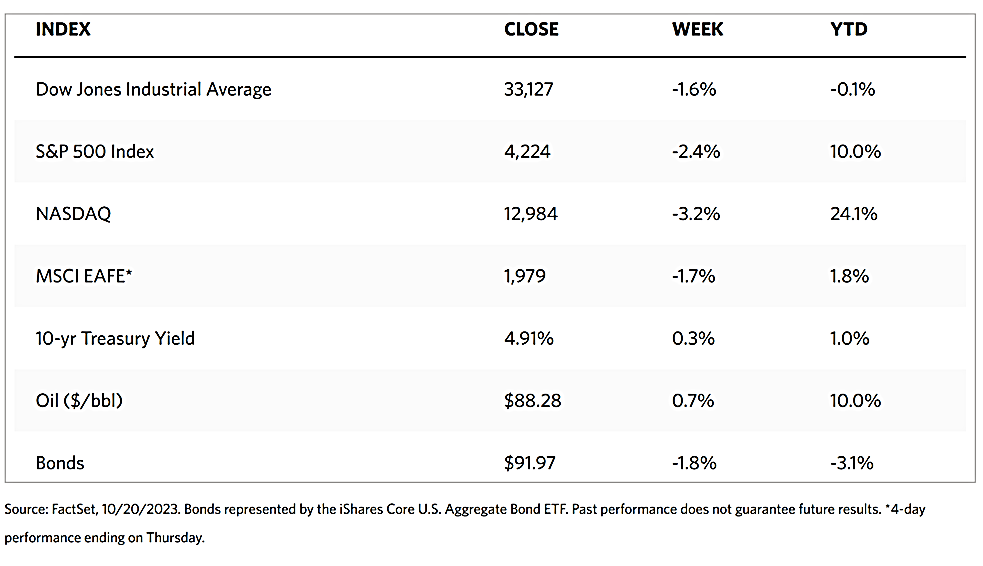
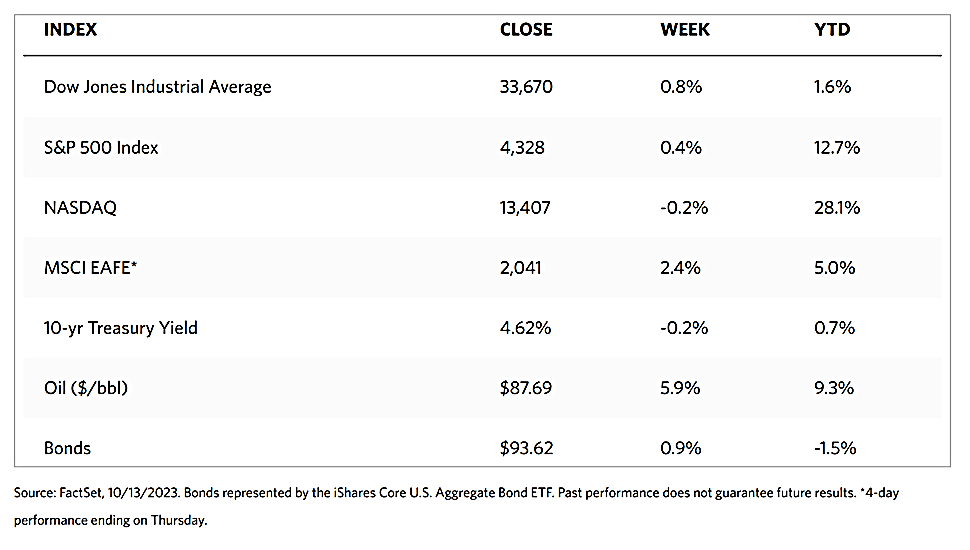
Markets Index Wrap-Up