Weekly Market Review – March 9, 2024

Stock Markets

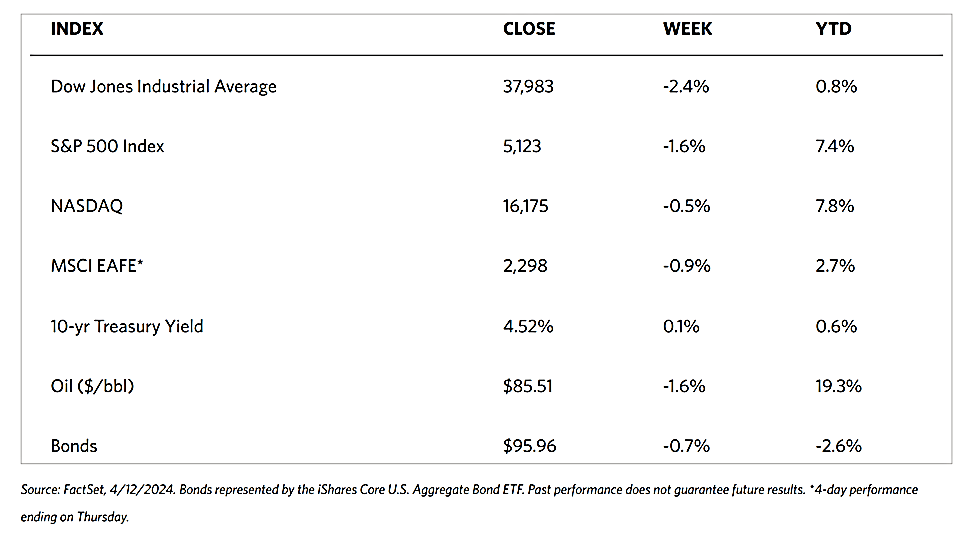
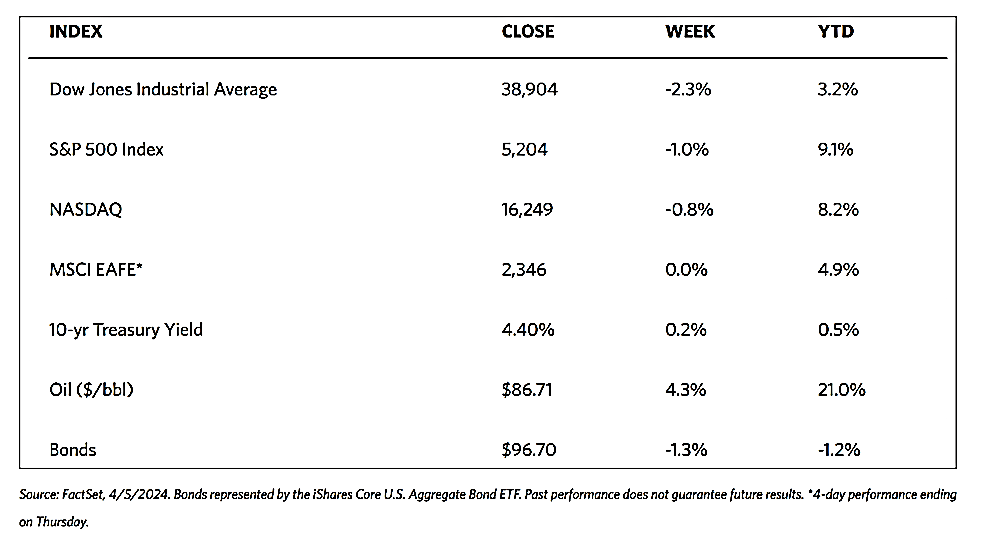
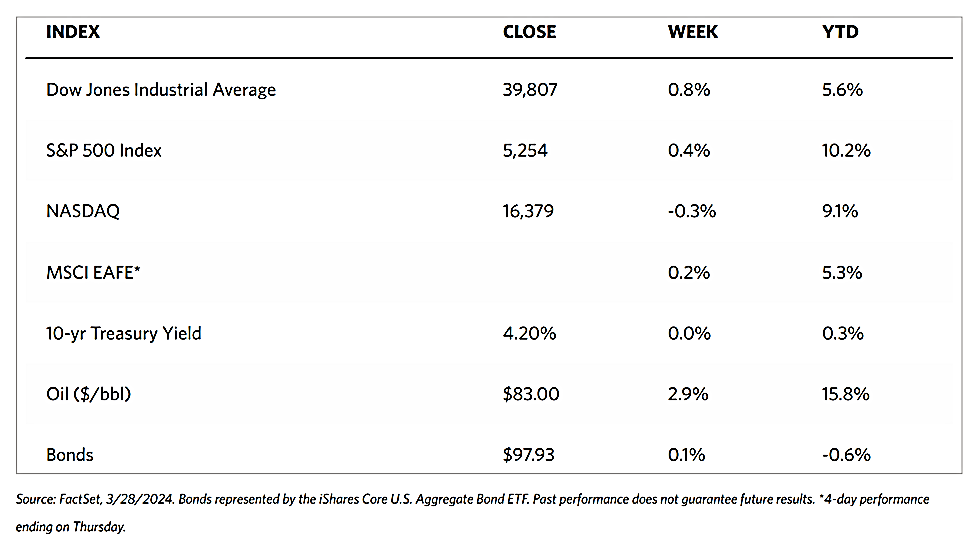
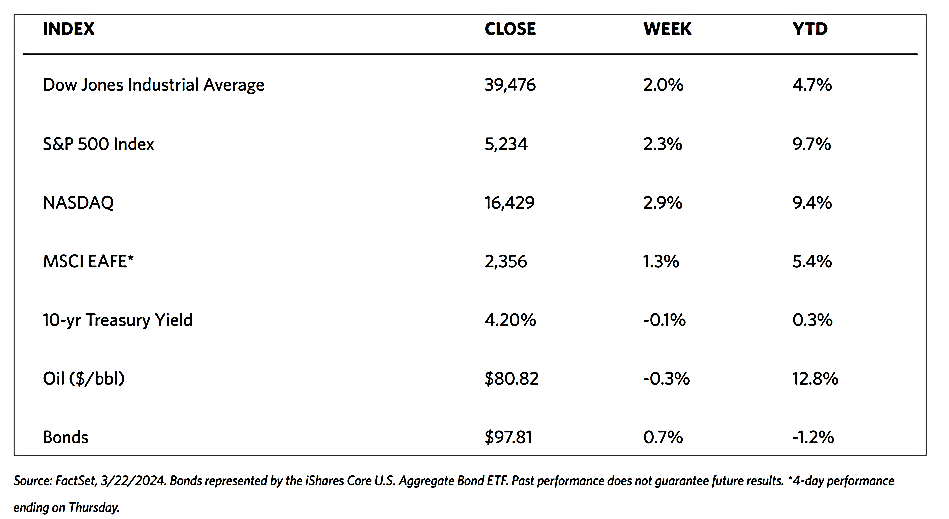
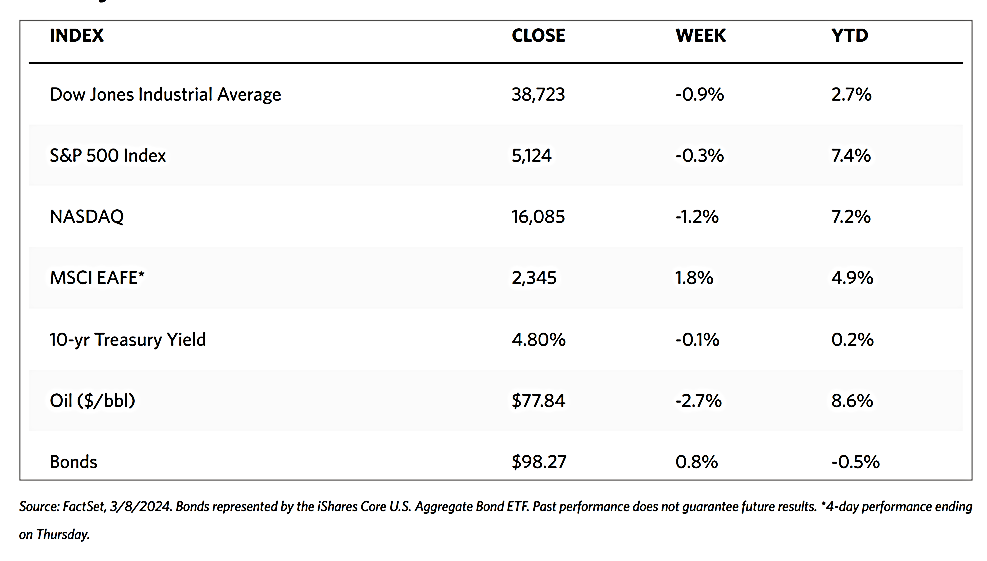
Major indexes ended slightly down this week. The Dow Jones Industrial Average (DJIA) shaved off 0.93% while the Dow Jones Total Stock Market dipped by 0.21%. The broad-based S&P 500 Index came down by 0.26% while the technology-tracking Nasdaq Stock Market Composite fell even further, losing by 1.17%. On the other hand, the NYSE Composite bucked the trend to close higher by 0.91%. Investor risk perception, as measured by the CBOE Volatility Index (VIX), climbed by 12.43% in reaction to increased uncertainties in the market.

The week began with a sell-off on Tuesday, as the S&P 500 fell by more than 1% for the first time since mid-February due to disappointing policy announcements from China. Stocks regained upward momentum by midweek, however, as the large-cap S&P 500 and the S&P MidCap 400 shot to new record intraday highs alongside the Nasdaq Composite this week. The strong surge was attributable to growing expectations that the Federal Reserve may begin to cut interest rates sooner than previously speculated. Small-cap and value shares outperformed. On the contrary, mega-cap shares lagged partly due to a decline in Apple following reports that iPhone sales were slowing in China. This was also the reason that Nasdaq underperformed the broader indexes. Despite this apparent breakout, most of the market reacted to higher-than-expected unemployment reports by the week’s end.

U.S. Economy

Over the week, some vital economic data weighed on the markets. Most notably, the U.S. unemployment rate was recorded at its highest level in two years. The U.S. nonfarm-jobs report was mixed but overall, it pointed to a cooling labor market. While the total jobs added in February totaled 275,000 which exceeded the targeted 200,000, the previous month’s reading was adjusted sharply lower, from 353,000 to 229,000. Also, the unemployment rate climbed from 3.7% to 3.9%, nearing its highest in two years. The nonfarm payrolls report revealed a weaker-than-forecast February ADP private-payrolls report. This revealed a total of 140,000 jobs added, which was short of the expected 150,000.

Another report released over the week was the ISM Manufacturing and Services data. These ISM data showed a sharp pullback in the employment indexes, indicating a contraction in the manufacturing and services sectors of the economy. The ISM data are comprehensive surveys of supply-management fundamentals and are taken by analysts to be leading indicators of the economy’s manufacturing and services industries. Regarding the manufacturing sector, this is the fifth consecutive monthly contraction of the ISM Employment index, with 10 industries reporting a decrease in employment and four industries reporting employment growth in February. The ISM Employment index in the services sector showed contraction for the second time in three months. Nine industries reported a decrease while six appointed an increase, and some indicated that they intend to increase hiring later in the year.

Metals and Minin

The precious metals markets, particularly regarding gold prices, surged to a new high this week. The underlying strength in gold is attributed to the anticipation of a Federal Reserve cut in interest rates by June. This past week, Fed Chair Jerome Powell hinted at the Central Bank’s possible rate reduction in the next few months, boosting market confidence and pushing gold to a new high of $2,152 in international markets on Wednesday. Speculation on the prospective rate cuts has sparked bullish sentiments in domestic and international markets, goading gold prices even higher after breaking out beyond its long-term resistance level.

The spot prices of precious metals rallied to record highs. Gold rose to $2,178.95 per troy ounce, which is 4.61% higher than last week’s close at $2,082.92. Silver closed at $24.31 per troy ounce,        5.15% over the closing price last week of $23.12. Platinum closed this week at $914.49 per troy ounce, rising 2.95% above the previous week’s close at $888.26. Palladium ended last week at $1,023.63 per troy ounce, gaining 6.85% above the previous week’s ending price of $958.04.  The three-month LME prices of base metals followed the same trend as precious metals. Copper, which closed the previous week at $8,493.50, ended this week at $8,640.50 per metric ton, gaining 1.73% for the week. Aluminum, which last traded at $2,228.00 the previous week, closed this week at $2,253.00 per metric ton for a gain of 1.12%. Zinc, which previously closed at $2,426.00, ended this week at $2,535.00 per metric ton for a rise of 4.49%. Tin, which was previously priced at $26,556.00, had a closing price this week of $27,607.00 per metric ton for a weekly gain of 3.96%.

Energy and Oil

Oil prices continued on their flatlining this week, unaffected by positive trade data out of China, and strong Indian oil demand. The continued build-up in U.S. crude inventories and the skepticism surrounding extended voluntary cuts by OPEC+ worked to offset what would have been the positive momentum in crude. February 7 marked the date when ICE Brent futures settled outside the $80-85 per barrel bandwidth for the last time. They suggest that the price movement this week marks a month-long sideways movement for oil. In the meantime, Red Sea hostilities claimed their first casualties as three sailors died in the Houthi’s attack on the Greek-owned Barbados-flagged dry bulk tanker True Confidence. The incident occurred some 50 nautical miles off the coast of Arden.  

Natural Gas

For the report week covering February 28 to March 6, 2024, the Henry Hub spot price climbed $0.03 from $1.63 per million British thermal units (MMBtu) to $1.66/MMBtu. Regarding the Henry Hub futures, the price of the April 2024 NYMEX contract increased by $0.044, from $1.885/MMBtu at the start of the report week to $1.929/MMBtu at the end of the week. The price of the 12-month strip averaging April 2024 through March 2025 futures contracts rose by $0.012 to $2.829/MMBtu.

International natural gas futures prices climbed this week. The weekly average front-month futures prices for liquefied natural gas (LNG) cargoes in East Asia increased by $0.10 to a weekly average of $8.36/MMBtu. Natural gas futures for delivery at the Title Transfer Facility (TTF) in the Netherlands rose by $0.74 to a weekly average of $8.38/MMBtu.  In the week last year corresponding to this week (the week from March 1 to March 8, 2023), the prices were $14.21/MMBtu in East Asia and $13.66/MMBtu at the TTF.

World Markets

European stocks were up this week as the pan-European STOXX Europe 600 Index climbed for the seventh consecutive week. The Index broke out to hit a record high on its way to a 1.14% gain for the week. The major indexes surged this week. Italy’s FTSE MIB added 1.43%, France’s CAC 40 Index gained 1.18%, and Germany’s DAX inched up by 0.45%. Bucking the trend was the UK’s FTSE 100 Index slid down by 0.30%. The ten-year government bond yields for Germany, Italy, and France declined in reaction to the European Central Bank (ECB) retaining its monetary policy unchanged and signaling that interest rates could be cut in June. The ECB revised its inflation and economic growth forecasts downward while leaving its key deposit rate unchanged at 4.0%. They also indicated that discussions have begun on dialing back restrictive policy later in the year. The ECB President Christine Lagarde stated that “good progress” has been realized toward the 2.0% inflation target, but also cautioned that the Governing Council still needed to confirm that the reduction in inflation was sustainable.

Japanese stocks ended mixed over the week. The Nikkei 225 Index closed 0.56% lower while the broader TOPIX Index gained 0.64%.  Artificial intelligence and solid corporate earnings drove some exuberance in the market and boosted investor confidence in the week. Speculation swirled around the Bank of Japan’s (BoJ’s) probable monetary policy trajectory. There are signs that the central bank is moving closer to raising short-term interest rates out of negative territory, about which policymakers appear to be gaining greater conviction than previously thought. A BoJ board member suggested that a virtuous cycle of prices rising in tandem with wages (a stated precondition for monetary policy tightening) was in sight. Against this development, the yield on the 10-year Japanese government bond rose to 0.73% from 0.71% at the end of the previous week. The strength of the yen weighs on Japan’s exporters as they realize significant dollar-denominated revenues. Over the past three years, Japanese stock markets have significantly gained on the back of the currency’s weakness.

Chinese stocks gained this week resulting from the government’s recent market stabilization measures. Despite an uncertain economic outlook, investor confidence was significantly lifted by the roll-out of the measures. The Shanghai Composite Index climbed by 0.63% while the blue-chip CSI 300 added 0.2%. The Hong Kong benchmark Hang Seng Index pulled back by 1.42%. At the National People’s Congress (NPC), China’s parliament which started on March 5 and will end March 11, Beijing set an economic growth target of around 5% for 2024. This target is the same as last year’s target when China’s economy officially rose by 5.2%. Analysts have expressed skepticism, however, that the country would find it difficult to match this growth rate, which benefitted from a post-lockdown rebound in early 2023. Beijing set the budget deficit at about the same target as last year, which was initially at 3% before it was subsequently raised to 3.8% to accommodate more borrowing. The government said that it would issue RMB 1 trillion in special ultra-long central government bonds to further support economic growth.

The Week

CPI and PPI inflation data for February and retail sales data are a few of the important economic data scheduled for release in the coming week.

Key Topics to Watch

  • NFIB optimism index for February
  • Consumer price index (CPI) for February
  • Core CPI for February
  • CPI year-over-year
  • Core CPI year-over-year
  • Monthly U.S. federal budget for February
  • U.S. retail sales for February
  • Retail sales minus autos for February
  • Producer price index (PPI) for February
  • Core PPI for February
  • PPI year-over-year
  • Core PPI year-over-year
  • Initial jobless claims for March 8
  • Business inventories off January
  • Empire State manufacturing survey for March
  • Import price index for February
  • Import price index minus fuel for February
  • Industrial production for February
  • Capacity utilization for February
  • Consumer sentiment (prelim) for March

Markets Index Wrap-Up

Weekly Market Review – March 2, 2024

Stock Markets

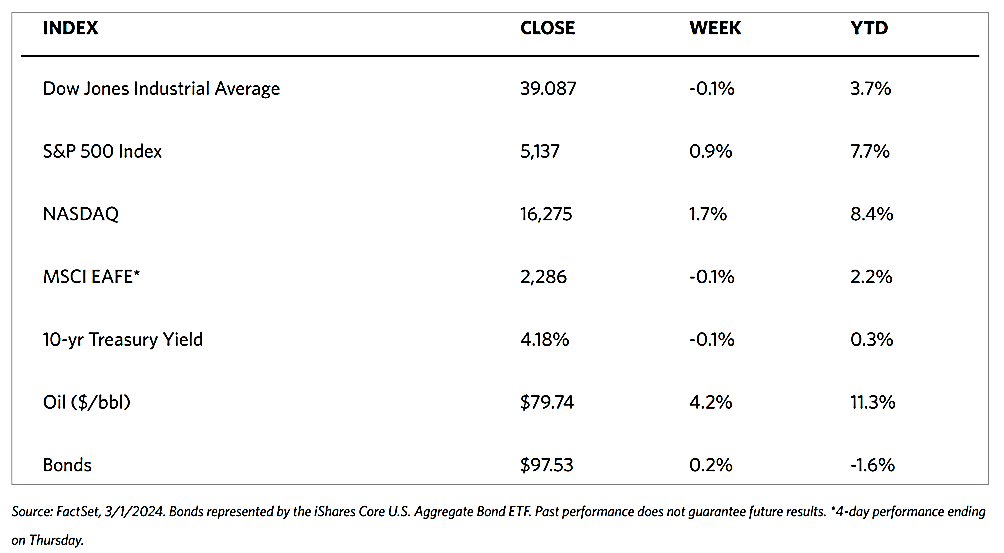
Markets were generally up this week except for the Dow Jones Industrial Average (DJIA), which closed by a modest 0.11% lower this week from last week. The Total Stock Market Index, however, ended slightly higher by 1.13%. The broad-based S&P 500 Index gained 0.95% while the Nasdaq Stock Market Composite climbed by 1.74%, reflecting the outperformance of technology-oriented stocks. The NYSE Composite ended with a 0.64% gain with all Russell Indexes ending up for the week. Investor risk perception, as measured by the CBOE Volatility Index (VIX) came down by 4.65%. The Nasdaq Composite joined the S&P 500 in record territory for the first time in over two years, underscoring the equity markets’ increasing strength. February was a particularly strong month for the S&P 500 which marked its strongest beginning two months of the year since 2019, as observed by the Wall Street Journal. In terms of market sentiment, the defining event of the week appeared to be the release by the Commerce Department on Thursday of the core (less food and energy) personal consumption expenditures (PCE) price index, an indicator of inflation.

U.S. Economy

The PCE price index rose by 2.8% for the 12 months ended in January, which aligns with expectations. The Commerce Department’s report seems to calm investors’ worries surrounding the Labor Department’s earlier pronouncement that shows that core prices rose by 3.9%, above the expected 3,7%. The core PCE price index is generally acknowledged to be the preferred gauge of the Federal Reserve regarding overall inflation pressures. In other economic news, the gauge for manufacturing activity by the Institute for Supply Management (ISM) came in significantly below expectations, Starting from an 18-month high of 49.1 in January, the metric fell back to 47.8 in February, keeping in mind that readings below 50 indicate contraction while those above 50 indicate expansion. A more reassuring picture was provided by durable goods, though, rising 0.1% in the month when the defense and aircraft sectors, both volatile components, are excluded. Personal incomes for February surprised on the upside, jumping 1.0% which is the biggest monthly gain of the year. In reaction to the PCE data and ISM report, by the end of the week, the yield on the benchmark 10-year Treasury note fell to its lowest intraday level since February 13. Recall that yields and bond prices move in opposite directions. As yields decreased U.S. Treasuries also generated positive returns amid a healthy Treasury supply concession.

Metals and Mining

This week, the gold futures market ended the week at a record high. Gold rallied by more than 2% this week, despite elevated bond yields and persistent strength in the U.S. currency, suggesting that underlying demand remains strong despite the lure of alternative investments. Some analysts express uncertainty as to whether the current rally in gold prices is sustainable. Despite growing bullish sentiment in the market, the recent rally does not appear to have solid fundamental support, therefore cautious optimism is advised. Gold has been trading within a tight range for the past few months, thus it is not surprising to see an outsized move as the market was bound to release some pressure. The market has to see some material weakness in the U.S. dollar for gold to maintain its upward momentum.

The spot prices for precious metals ended the week mixed. Gold rose by 2.33%, from last week’s closing price of $2,035.40 to this week’s closing price of $2,082.92 per troy ounce. Silver gained 0.74% from its end last week at $22.95 to this week’s end at $23.12 per troy ounce. Platinum lost 1.51% from last week’s close at $901.91 to this week’s close at $888.26 per troy ounce. Palladium descended by 1.85% from its last trade last week at $976.13 to its last trade this week at $958.04 per troy ounce. The three-month LME prices of industrial metals were also mixed. Copper descended by 0.86% from its last price one week ago at $8,567.50 to its last price this week at $8,493.50 per metric ton. On the other hand, aluminum gained 2.20% from its closing price last week at $2,180.00 to its closing price this week at $2,228.00 per metric ton. Zinc rose by 0.87% this week, from $2,405.00 to $2,426.00 per metric ton. Tin also rose, this time by 0.66% from last week’s close at $26,382.00 to this week’s close at $26,556.00.

Energy and Oil

The trading patterns for crude failed to respond to diverging macroeconomic news as China and Europe continued to struggle with below-expectations manufacturing activity and the U.S. nears the point of first interest rate cuts. Brent maintained at a level around the $83 per barrel support throughout the week. Looking forward, the next expected price-moving catalyst in the oil markets will be OPEC+ announcing whether it will revise or extend its voluntary production cuts next week (although revisions will be highly unlikely at this point). In the meantime, the market, particularly Indian importers of thermal fuel, is broadly expected to reduce their purchases of Russian coal,  which is up by 20% year-on-year in 2023 at 10.06 million tons, after the US-sanctioned SUEK and Mechel, Russia’s top coal exporters.

Natural Gas

For the report week beginning Wednesday, February 21, and ending Wednesday, February 28, 2024, the Henry Hub spot price rose by $0.03 from $1.60 per million British thermal units (MMBtu) to $1.63/MMBtu. Regarding the Henry Hub futures price, the March 2024 NYMEX contract expired on Tuesday, Feb. 27, at $1.615/MMBtu, down by $0.16 from the start of the report week. The April 2024 NYMEX contract price increased to $1.885/MMBtu, up by $0.02 from the start to the end of the report week. The price of the 12-month strip averaging April 2024 through March 2025 futures contracts rose by $0.09 to $2.817/MMBtu.

International natural gas futures prices decreased this report week. The weekly average front-month futures prices for liquefied natural gas (LNG) cargoes in East Asia dropped by $0.39 to a weekly average of $8.26/MMBtu. Natural gas futures for delivery at the Title Transfer Facility (TTF) in the Netherlands, the most liquid natural gas market in Europe, descended by $0.11 to a weekly average of $7.64/MMBtu. In the week last year corresponding to this report week (beginning February 22 and ending March 1, 2023), the prices were $14.76/MMBtu in East Asia and $15.10/MMBtu at the TTF. 

World Markets

The European equity markets showed an underlying resilience, maintaining near their highs for the week despite the lack of buying momentum, keeping the pan-European STOXX Europe 600 Index little changed. Investors reassessed the magnitude and timing of interest rate cuts by the European Central Bank in 2024, due to sticky inflation data. The major stock indexes were mixed in the region. Germany’s DAX climbed by 1.81% and Italy’s FTSE MIB rose by 0.71%. France’s CAC 40 Index gave back 0.41%, and the UK’s FTSE 100 lost by 0.31%. As expected, European government bond yields ended broadly higher. Inflation remains a concern as both headline and core inflation readings slowed less than expected in February. In the eurozone, annual consumer price growth decelerated modestly to 2.6% while core inflation slowed to 3.1%, which disappointed as it remained above the consensus estimate of 2.9%. For February, the European Commission’s economic sentiment indicator unexpectedly fell to 95.4. Confidence remained broadly stable in the industrial sector amid weak production expectations and a likely bottoming out of a drop in new orders. Confidence worsened in the services sector, however, due to lower demand. In both goods and services, selling price expectations eased.

Japanese equities were strong this week as the Nikkei hovered at around new highs, gaining about 2.1%, to elevate February’s gains to about 10.0%. The TOPIX likewise gained ground, ending the week higher by 1.8%. The monetary policy of the Bank of Japan (BoJ) remained highly accommodative as BoJ Governor Kazuo Ueda emphasized that it was too soon to conclude that the central bank had achieved its 2% inflation target sustainably. Ueda, stressed that prices rising in tandem with wages was a precondition for the BoJ to change its current stance. Japan’s consumer inflation, as indicated by the core consumer price index (CPI), slowed to 2.0% year-on-year in January from December’s 2.3%. Regarding the nation’s currency, while the yen remained broadly unchanged for the week at about JPY 150.5 versus the U.S. dollar, historic weakness in the yen provided an advantage for share price gains, especially for Japan’s exporters due to increased revenues derived from overseas. The yield on the 10-year Japanese government bond moved only slightly this week, settling at about 0.71%.

In China, equities rose on expectations that Beijing may attempt to stimulate growth by boosting monetary easing measures.  The Shanghai Composite Index rose by 0.74% while the blue-chip CSI 300 gained by 1.38%. On the other hand, Hong Kong’s benchmark Hang Seng Index slid by 0.82%. February’s economic reports continued to portray a mixed outlook for the country/ The official manufacturing purchasing managers index (PMI) fell from January’s 49.2 rating to February’s 49,1, remaining below the 50-mark threshold delineating growth from contraction. The reduction was attributed to declines in production and exports. Seasonal factors likewise weighed in since factories were closed for the Luna New Year holiday from February 10 to February 19. The non-manufacturing PMI, on the contrary, rose to a better-than-expected 51.4 from 50.7 in January. By comparison, the private Caixin/S&P Global survey of manufacturing activity climbed up to 50.9 in February, marking its fourth month of expansion and coming in higher than expected.

The Week Ahead

The ISM services PMI, the nonfarm payrolls report, and factory orders for January are some of the important economic news scheduled to be released this week.

Key Topics to Watch

  • Factory orders for January
  • ISM services for February
  • ADP employment for February
  • Fed Chair Jerome Powell testifies to Congress (Wed., March 6)
  • U.S. wholesale inventories for January
  • Job openings for January
  • San Francisco Fed President Mary Daly speaks
  • Federal Reserve Beige Book
  • Minneapolis Fed President Ned Kashkari speaks
  • Initial jobless claims for March 2
  • U.S. productivity (revision) for Q4
  • U.S. trade balance for January
  • Fed Chair Jerome Powell testifies to Congress (Thurs., March 7)
  • Cleveland Fed President Loretta Mester speaks
  • Consumer credit for January
  • New York Fed President John Williams speaks
  • U.S. nonfarm payrolls for February
  • U.S. unemployment rate for February
  • U.S. hourly wages for February
  • Hourly wages year-over-year

Markets Index Wrap-Up

Weekly Market Review – February 24, 2024

Stock Markets

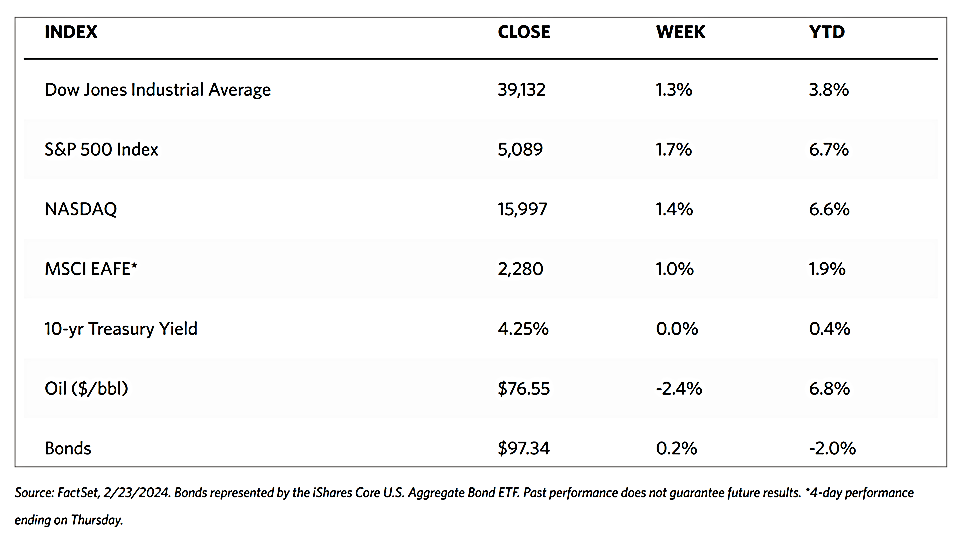
All major stock indexes rose for this shortened trading week to recover the ground lost in last week’s slump. The Dow Jones Industrial Average (DJIA) gained by 1.30%, its transportation sector overperforming with a 1.87% gain compared with the total stock market index that advanced by 1.41%. The broad-based S&P 500 Index climbed by 1.66% and the technology-heavy Nasdaq Stock Market Composite realized a gain of 1.40%, suggesting strong buying across the board. The NYSE Composite went up by 1.19%. The CBOE Volatility Index (Vix) retracted by 3.44%, indicating a lower risk perception by investors.

Both the S&P 500 and the Nasdaq Composite Index hit new intraday highs during the week, with the latter posting its biggest daily gain in its year-to-date performance on Thursday. On that day, NVIDIA’s market capitalization added a record $277 billion. The chipmaker exceeded Wall Street estimates when it reported strong quarterly revenue and earnings the day after the runup. The company added to its full-year guidance on robust demand for its chips which are a main component in artificial intelligence applications. The stock rally sparked by NVIDIA’s strong earnings also appeared to be supportive of high-yield bonds, since a lack of sellers in the high yield bond market manifested a solid demand for new issues in the fixed-income markets.

U.S. Economy

Economic releases were light during the week, with most data aligning with expectations. The exceptions were the initial and continuing jobless claims, which both came in below consensus estimates and suggested that the labor market remained tight. In the week ended February 17, 201,000 new claims were filed on a seasonally adjusted basis indicating a decline of 12,000 against that of the preceding week. The number of continuing claims declined by 27,000 to 1.862 million. Also, this week, S&P Global released early estimates of its purchasing managers indexes (PMIs) for manufacturing and services. Business activity in the services sector slightly cooled with its PMI pulling back to 51.3 from 52.5 in January. On the other hand, manufacturing activity rose unexpectedly to 51.5, its highest level in 17 months, which was in part attributable to an increase in export orders. Both gauges remained above 50, the line dividing contraction from expansion with readings north of 50 indicating positive growth. Overall, the economic improvement, though falling short of heating up, does not call for the reversal of interest rates because of the higher-than-expected January inflation reading, coupled with the tight jobs market and the strength of the economy in the fourth quarter.

Metals and Mining

While gold prices continue to hold above the $2,000-per-ounce support level, the price action does not seem to inspire bullish momentum from investors. The tech sector continues to draw investor confidence away from gold, due to advances in Artificial Intelligence. The significant profits reported by AI chipmaker NVIDIA for the fourth quarter of 2023 drew investor interest this week. A report of $22.10 billion in revenues represented a year-on-year rise of 265%, surging net income by 769%. The numbers are drawing market interest away from gold and towards equities due to investors’ fear of missing out.  

The spot market for precious metals ended the week mixed. Gold closed this week at $2,035.40 per troy ounce, higher by 1.08% from last week’s close at $2,013.59. Silver ended this week at $22.95 per troy ounce, lower by 2.01% from last week’s ending price of $23.42. Platinum closed this week at $901.91 per troy ounce, a loss of 0.85%            from last week’s close at $909.63. Palladium ended this week at $976.13 per troy ounce, 2.60% higher than its previous week’s close at $951.37. The three-month LME prices for base metals were also mixed. Copper gained 3.05% from its previous close at $8,314.00 to its recent weekly close at $8,567.50 per metric ton. Aluminum, which closed last week at $2,224.50, lost 2.00% of this value to end this week at $2,180.00 per metric ton. Zinc gained 2.14% from its close last week at $2,354.50 to end this week at $2,405.00 per metric ton. Tin, which came from $27,293.00 last week, closed this week at $26,382.00 per metric ton for a decline of 3.34%.

Energy and Oil

There has been remarkable volatility in oil trading over the past weeks. Lately, Brent futures moved within a narrow bandwidth between $81 and $84 per barrel. The minor day-on-day moves in crude appear to be dominated by macro factors, responding to warnings by two Federal Reserve governors against interest rate cuts in the next two months. As a result, oil prices are bound to decline slightly towards the end of the week, as Brent is set to close the week at approximately $82 per barrel. In the global sphere, Iraq restarted the 310,000 barrel per day (b/d) Baiji refiner shut down in 2014, and Baghdad expects the plant to be running at 150,000 b/d soon. Furthermore, Venezuela makes its first-ever purchase of Russian crude oil in a sign of the country preparing for a potential snapback of U.S. sanctions in April.

Natural Gas

For the report week from Wednesday, February 14 to Wednesday, February 21, 2024, the Henry Hub spot price rose by $0.09 from $1.51 per million British thermal units (MMBtu) when the week began to $1.60/MMBtu at the end of the week. Regarding Henry Hub futures, the price of the March 2024 NYMEX contract increased by $0.164, from $1.609/MMBtu when the week began to $1.773/MMBtu when the week ended. The price of the 12-month strip averaging March 2024 through February 2025 futures contracts ascended by $0.191 to $2.608/MMBtu.

International natural gas futures prices descended for this report week. The weekly average front-month futures prices for liquefied natural gas (LNG) cargoes in East Asia fell by $0.77 to a weekly average of $8.65/MMBtu. Natural gas futures for delivery at the Title Transfer Facility (TTF) in the Netherlands, the most liquid natural gas market in Europe, fell by $0.51 to a weekly average of $7.75/MMBtu. In the week last year corresponding to this report week (week from February 15 to February 22, 2023), the prices were $15.34/MMBtu in East Asia and $15.64/MMBtu at the TTF.

World Markets

European stocks jumped to record levels this past week. In local currency terms, the pan-European STOXX Europe 600 Index surged to end the week 1.15% higher on stellar quarterly results from NVIDIA. The chipmaker’s earnings report stoked a global rally and demand for technology stocks. Italy’s FTSE MIB gained 3.05%, France’s CAC 40 Index advanced 2.56%, and Germany’s DAX ascended 1.76%. The UK’s FTSE 100 Index was only slightly changed, reflecting a weakness in energy and mining stocks. European government bond yields climbed across the board as investors narrowed their bets on the likely number of interest rate cuts this year, in light of the stronger-than-expected purchasing managers’ surveys. Early PMI data for February indicates that the eurozone economy could be stabilizing on the back of a recovery in the services sector. The HCOB eurozone composite PMI for output was provisionally estimated to rise to 48.9 from January’s 47.9. The February figure is an eight-month high but remains in contraction territory.

Japanese equities trading ended on Thursday (the markets were closed on Friday due to the celebration of the Emperor’s Birthday).  During this shortened trading week, stocks ended at a new all-time high, with the Nikkei 225 Index breaking the previous record set in December 1989, more than three decades ago. The broader TOPIX likewise ended at its highest level since February 1999, as confidence was underpinned by both a return to steady growth and corporate profitability. It was not all plain sailing, however. What was originally a four-day losing streak was snapped by a Thursday rally ahead of the Emperor’s Birthday holiday. In the fixed-income market, 10-year Japanese government bond yields ended the week at 0.711%, slightly down from the previous Friday’s yield of 0.725%. Regarding Japan’s economy, core machinery orders climbed by a seasonally adjusted 2.7% in December from a contraction of 4.9% in November. Japanese export data was likewise strong as it rose to a record high in January, with an 11.9% increase and marking a second straight month of positive growth. Later in the month, however, data from Japan’s manufacturing sector was lower than expected. The PMI for the manufacturing sector came in at 47.2, down from 48.0 in January.

Chinese stocks rose after a week when trading was suspended in observance of the Lunar New Year. Equities rallied as hopes reignited for economic recovery after a week of holiday spending. The Shanghai Composite Index surged by 4.85% while the blue-chip CSI 300 gained by 3.71%. Meanwhile, the Hong Kong benchmark Hang Seng Index climbed by 2.36%. Over the weeklong Lunar New Year holiday, tourism revenue rose by 47% over the same period in 2023 and surpassed pre-pandemic levels. Domestic trips gained by 34% over that of last year, and international trips likewise increased. Average spending per trip, however, fell by 9.5% from 2019 before the pandemic, which indicates that consumers still have lingering concerns about the robustness of the economic recovery. It should be noted that this year’s holiday lasted for eight days, one day longer than the 2019 holiday.  Regarding the real property sector, new home prices in 70 cities fell by 0.3% sequentially in January. This marks the seventh monthly contraction, according to Bureau statistics.

The Week Ahead

PCE inflation data, GDP fourth quarter data, and the ISM manufacturing PMI are among the important economic data scheduled to be released in the coming week.

Key Topics to Watch\

  • New home sales for January
  • Durable goods orders for January
  • Durable goods minus transportation for January
  • S&P Case-Shiller home price index (20 cities)
  • Consumer confidence for February
  • GDP (first revision) for Q4
  • Advanced U.S. trade balance in goods for January
  • Advanced retail inventories for January
  • Advanced wholesale inventories for January
  • Atlanta Fed President Raphael Bostic speaks (Feb. 28)
  • Initial jobless claims for Feb. 24
  • Personal income (nominal) for January
  • Personal spending (nominal) for January
  • PCE index
  • Core PCE index
  • PCE (year-over-year)
  • Core PCE (year-over-year)
  • Chicago Business Barometer (PMI) for February
  • Pending home sales for January
  • Atlanta Fed President Raphael Bostic speaks (Feb. 29)
  • Chicago Fed President Austan Goolsbee speaks
  • Cleveland Fed President Loretta Mester speaks
  • Kansas City Fed President Jeff Schmid speaks
  • S&P U.S. manufacturing PMI (final) for February
  • ISM manufacturing for February
  • Construction spending for January
  • Consumer sentiment (final) for February
  • Dallas Fed President Lorie Logan speaks
  • Fed Governor Chris Waller speaks
  • Atlanta Fed President Raphael Bostic speaks (Mar. 1)
  • San Francisco Fed President Mary Daly speaks

Markets Index Wrap-Up
Weekly Market Review – February 17, 2024

Stock Markets

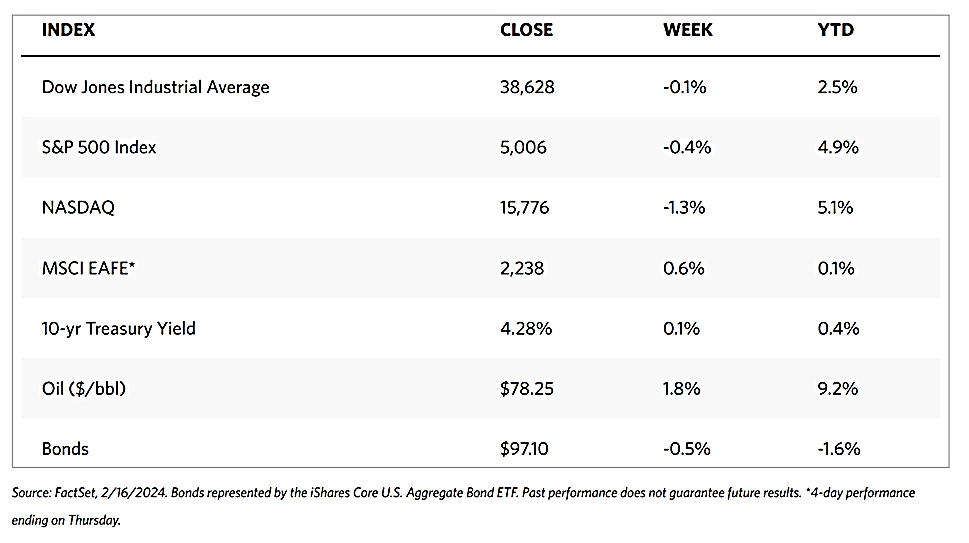
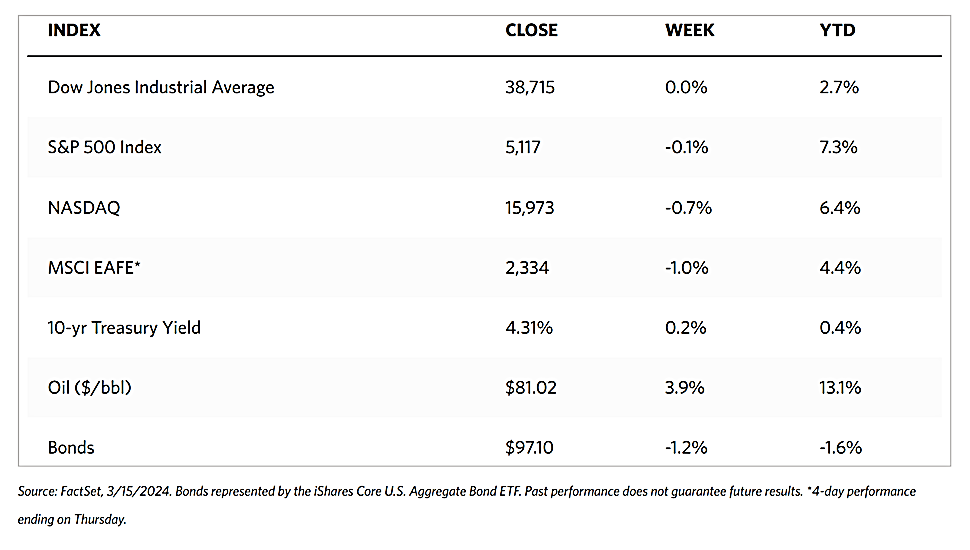
The major stock indexes went south this week, albeit modestly. The Dow Jones Industrial Average (DJIA) dipped by 0.11% while the DJ Total Stock Market Index fell slightly further, by 0.26%. The broad-based S&P 500 Index slipped by 0.42% while the technology-heavy Nasdaq Stock Market Composite fell a bit more, by 1.34%. The NYSE Composite bucked the trend and gained 0.77%. The CBOE Volatility Index (VIX), the metric for investor risk perception, rose by 10.13%. Some earnings reports that surprised on the upside provided some buying incentive, causing the equally weighted version of the S&P 500 Index to reach a record high on Thursday. The investors’ sell-out was due to negative developments in the macroeconomic news of the week. The declines were concentrated in large-cap growth stocks, since the small-cap Russell 2000 Index rebounded to register gains by the week’s end.

The slump in stocks can be attributed to the inflation report that came out this week. January’s Consumer Price Index (CPI) and Producer Price Index (PPI) inflation reports that were released this week were higher than expected. Stocks dropped sharply when the inflation reports were released on Tuesday but recovered before trading ended to close only marginally lower. Although the reports were disappointing, it is too soon to conclude that the trend of descending inflation has reversed and it will soon trend higher. But grounds are likely eroding for expectations that the Federal Reserve interest rate cuts will be coming sooner than later. A trend towards rising inflation is just not justifiably sustainable at present.  

U.S. Economy

The higher inflation readings are the results of certain components in the CPI basket. Consumer prices rose 0.3% in January, higher than the consensus expectation of 0.2%. More worrisome is the rise in core consumer prices which hit 0.4%. This kept the year-over-year inflation at 3.9%, almost double the Federal Reserve’s target of 2%. Producer prices, which are usually more volatile than consumer prices, increased by 0.3% in January, the most in five months and higher than December’s reading of 0.1%. The main contributor was a 2.2% increase in the cost of hospital outpatient care.

Inflation was more moderate in energy and energy services, commodities, and used car and truck pricing. Nevertheless, food and food away from home (such as in restaurants) climbed higher, together with motor vehicle insurance. The most critical components that moved up were shelter and rent, which account for almost one-third of the CPI basket. These components were higher than expected, registering an increase of 6% annually. However, they often lag behind current developments in the housing and rental markets nationwide. Over the past year, real-time data suggests that these components are likely to cool in the coming months. CPI is expected to fall to approximately 2.5% over the coming year. If this materializes, it is good news because not only does it tend to provide support for consumers, but it also gives the Fed a reason to at last consider cutting interest rates.  

The week also brought news of slowing economic growth, which, while concerning, nevertheless eased fears of a resurging inflation rate. The Commerce Department on Thursday reported that retail sales fell in January by 0.8%. Some economists cited seasonal factors and harsher weather conditions in January, but other weather-sensitive sales at restaurants and bars surprisingly increased by 0.7%. Continuing claims were slightly above expectations although initial jobless claims were slightly below consensus. Housing starts that came out on Friday were lower than expected, but a gauge of homebuilder confidence trended surprisingly higher.

Metals and Mining

Due to the sentiment that the Fed is still a long distance from its inflation target of 2%, gold and silver prices fell to their lowest in months, and now are testing their supports at $2,000 and $22 per ounce respectively. Investors are selling off from the gold market, due to higher-for-longer interest rates supporting higher bond yields and a stronger U.S. dollar. Investors continue to push equities to record highs rather than remain in the gold market. So far this year, more than $3 billion has exited the global gold-backed exchange traded products, while the newly approved Bitcoin ETFs have experienced total inflows of $4.115 billion. Nevertheless, there is underlying strength in the precious metals market, as they have so far held at their critical support levels despite strong selling pressure.

This week, the spot market for precious metals was mixed. Gold lost by 0.53% from its close last week at $2,024.26 to its close this week at $2,013.59 per troy ounce. Silver gained by 3.58% from its closing price last week of $22.61 to its closing price this week of $23.42 per troy ounce. Platinum, which ended this week at $909.63 per troy ounce, climbed by 3.72% from last week’s close at $877.04. Palladium, closing this week at $951.37 per troy ounce, appreciated by 10.39% from its closing price last week at $861.86. The three-month LME prices of industrial metals generally rose this week. Copper, the price of which was $8,193.50 last week, climbed by 1.47% to settle this week at $8,314.00 per metric ton. Zinc gained 1.16% for the week, beginning at last week’s closing price of $2,327.50 to end at $2,354.50 per metric ton this week. Aluminum, which was priced at $2,221.50 last week, climbed by 0.14% to end this week at $2,224.50 per metric ton. Tin ended at $27,293.00 per metric ton this week, up by 5.40% from last week’s close at $25,895.00.     

Energy and Oil

This week oil prices continued its sideways trek of the past weeks. Some bullish activity from weak U.S. retail sales was rapidly curtailed by a fresh escalation of the Middle East political unrest as Israel attacked Rafah, potentially prompting a Houthi retaliation soon. Speculation is growing that production cuts by OPEC+ in 2024 appear to be ignored by the members of the oil group. If there is any truth to this narrative, the impact has still to become evident in Brent’s price which currently remains at $82 per barrel. In any case, the Iraqi oil ministry confirmed that over the next four months, it would compensate for its January increase in crude production. OPEC’s secondary sources estimate Iraq’s output at 4.19 million barrels per day (b/d), which is about 190,000 b/d above target

Natural Gas

For the report week covering Wednesday, February 7, to Wednesday, February 14, 2024, the Henry Hub spot price fell by $0.46 from $1.97 per million British thermal units (MMBtu) to $1.51/MMBtu throughout the week. The Henry Hub spot price averaged $1.88/MMBtu so far this month, the lowest inflation-adjusted monthly average since at least January 2000, according to data from Natural Gas Intelligence. Regarding the Henry Hub futures, the price of the March 2024 NYMEX contract decreased by $0.358, from $1.967/MMBtu at the start of the report week to $1.609/MMBtu at the end of the week. The price of the 12-month strip averaging March 2024 through February 2025 futures contracts declined by $0.224 to $2.417/MMBtu.

International natural gas futures prices decreased during this report week. The weekly average front-month futures prices for liquefied natural gas (LNG) cargoes in East Asia declined by $0.04 to a weekly average of $9.42/MMBtu. Natural gas futures for delivery at the Title Transfer Facility (TTF) in the Netherlands, the most liquid natural gas market in Europe, also declined, by $0.81 to a weekly average of $8.26/MMBtu. In the week last year that corresponds to this report week (week from February 8 to February 15, 2023), the prices were $17.91/MMBtu and $16.68/MMBtu in East Asia and at the TTF, respectively.

World Markets

European stocks advanced for the week as the pan-European STOXX Europe 600 Index gained 1.39% in local currency terms. The improved investor sentiment is due to signs of cooling inflation and optimism regarding the possibility of interest rate cuts. Italy’s FTSE MIB outshined, rising by 1.85%, while France’s CAC 40 Index hit new highs during the week and closed on Friday higher by 1.58% week-over-week. Germany’s DAX also impressed, gaining by 1.13% for the week. The UK’s FTSE 100 rose by 1.84% for the week. Core eurozone government bond yields recorded modest gains in response to reports that the U.S. announced higher-than-expected inflation readings. European Central Bank (ECB) officials cautioned against “making a hasty decision,” in the words of ECB President Christine Lagarde, in hastily crafting policy decisions just in case inflation reverses course and heads up again. In the meantime, official UK economic data places the country in recession territory in the final three months of 2023, and that inflation held steady in January, furthering market expectations that the Bank of England (BoE) may cut interest rates by June.  

Japan’s equities markets climbed during the week. The Nikkei 225 Index gained by 4.3% while the broader TOPIX Index rose by 2.6%. The Nikkei continued its strong performance in the year-to-date period and the year 2023, now holding around its highest level in 34 years. Positive corporate earnings releases and the continued weakness in the yen provided support to the rally. Regarding economic performance, Japan’s weak fourth-quarter growth data fostered some uncertainty regarding the future direction of the Bank of Japan’s monetary policy, which the BoE anchored on sustainability in achieving its 2% inflation target. The yield on the 10-year Japanese government bond closed the week mostly unchanged at 0.73%. Investors factored in the most recent U.S. economic data, including its inflation reports, and the possible impacts they may have on the timing of future Federal Reserve rate cuts. The yen weakened to the low JPY 150 range from the low JPY 149 range at the end of the previous week. The weak yen has redounded to a competitive advantage for Japanese exporters because it increases the domestic value of their overseas revenues.

China’s financial markets were closed for the week in observance of the weeklong Lunar New Year holiday that commenced on Saturday, February 10. There was a pickup in consumer spending over the Lunar New Year, China’s most important holiday, as indicated by early data. During the first six days of the national holiday, more than 61 million rail trips were made. This is a 61% jump over comparative figures last year, according to official media reports. State media reported that hotel sales on China’s e-commerce platforms increased by more than 60% while travel by road and airplane likewise improved. Analysts were quick to caution, however, that the year-over-year consumption figures may be misleading, given that China was in the throes of a coronavirus outbreak in early 2023 which caused Beijing to roll back pandemic restrictions in December 2022.

The Week Ahead

The January FOMC minutes and the S&P Global PMI data are among the important economic data scheduled for release in the coming week.

Key Topics to Watch

  • U.S. leading economic indicators
  • Atlanta Fed President Raphael Bostic delivers welcome remarks
  • Fed Gov. Michelle Bowman speaks
  • Minutes of Fed’s January FOMC meeting
  • Initial jobless claims for Feb. 17
  • S&P flash U.S. services PMI for February
  • S&P flash U.S. manufacturing PMI for February
  • Existing home sales for January
  • Fed Vice Chair Philip Jefferson speaks
  • Philadelphia Fed President Patrick Harker speaks
  • Fed Gov. Lisa Cook speaks
  • Minneapolis Fed President Neel Kashkari speaks
  • Fed Gov. Christopher Waller speaks

Markets Index Wrap-Up

Weekly Market Review – February 10, 2024

Stock Markets

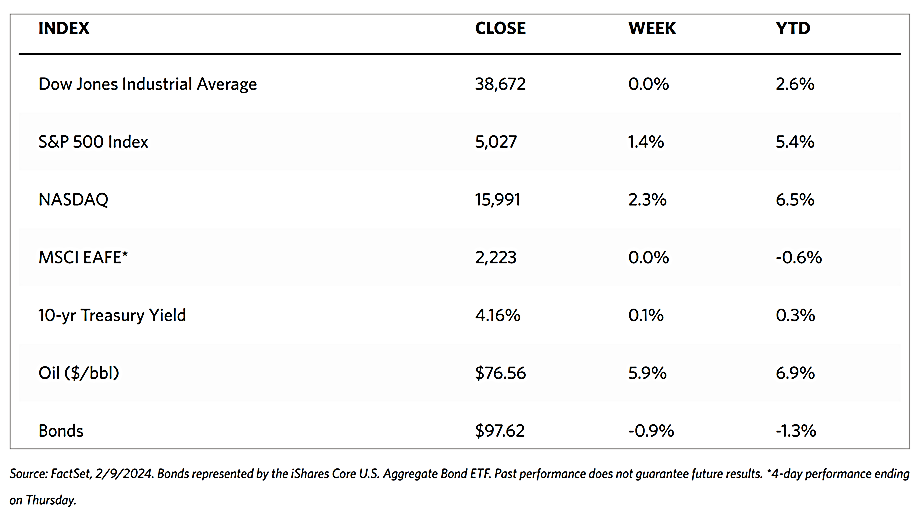
Markets continued to trek upward this week into record-breaking territory although the advance was narrow. The Dow Jones Industrial Average (DJIA) gained 0.04% week-on-week while the DJ Total Stock Market Index climbed by 1.51%. The technology-heavy Nasdaq Stock Market Composite gained 2.31% while the NYSE Composite rose by 1.02%. CBOE Volatility Index, the risk perception indicator, fell by 6.64% for the week. The big news, however, surrounded the meteoric rise of the S&P 500 Index which gained 1.35% but, in doing so, broke and held above the 5,000 long-term resistance level for the first time. The index traded at a high of 5.030.06 and a low of 5,000.34 for the week, closing on Friday at 5,026.61.

The continued market gains were heartening although the narrow climb may be a sign that this rally will not last. The equally weighted version of the S&P 500 Index significantly lags behind the standard market-weighted version for the fourth time in five weeks, suggesting that not all the counters are seeing new gains. There is also a downward trend in the number of stocks remaining above their 50-day moving averages. This is not necessarily an omen of bad fortune ahead, as the lack of buying interest may simply be the result of the lack of fresh economic data that would move the markets, so investors are focusing on individual companies’ earnings reports for buying motivation. Nevertheless, it would not be out of the ordinary if, after breaking into new highs, the market may come down to consolidate before it rallies again.

U.S. Economy

The economic surprises this week came from S&P Global’s assessment of the services sector activity. The services sector remains in remarkably good shape, jumping unexpectedly to a four-month high back into expansion territory, from December’s 50.5 to a solid 53.4 in January (readings above 50 signal expansion, below 50 indicate contraction). The counterpart metric of the Institute of Supply Management likewise indicated solid growth at 55.8, however, its measure of prices paid for services climbed to its highest level in almost a year. This reading sharply contrasted with recent data on prices paid by manufacturers, which have signaled falling prices for many inputs. The Labor Department on Friday lowered its initial estimate of December consumer inflation, from 0.3% to 0.2%.

In the assessment of many analysts, a hard recession appears to be increasingly unlikely as the Fed gradually shifts policies from hawkish to dovish, The worst-case scenario for the economy is dimming, but that does not completely discount the chances of even a mild recession or soft landing. A lower percentage of banks reported a tightening of credit conditions in the latest Senior Loan Officer Opinion Survey (SLOOS) released last week, which may suggest that a possible bottoming out in the credit cycle is imminent or has been passed. Although consumer spending will likely slow down, other economic sectors may be gaining momentum to provide an offset in the last semester of this year.

Metals and Mining

This week, gold prices continued to consolidate in a tight band between $2,000 and $2,050 per ounce. Nevertheless, consultants have confirmed that there remains pent-up demand for the precious metal, thus keeping the market for gold robust even if prices do not appear to have any strong bullish momentum. The volume of sales continues to be impressive in the present price environment, even if volumes do not meet the levels they were at last year. Analysts further note that Asian investors are buying precious metals, not only because of the Lunar New Year but to preserve their wealth in light of the uncertainty in the equity markets which may turn volatile.

This week, precious metals were mostly down. Gold lost by 0.76% from last week’s closing price of $2,039.76 to close this week at $2,024.26 per troy ounce. Silver fell by 0.35% from last week’s closing price of $22.69 to end this week at $22.61 per troy ounce. Platinum lost by 2.22% from its closing price one week ago at $896.95 to its closing price this week of $877.04 per troy ounce. Palladium ended this week at $861.86 per troy ounce, 9.17% lower than last week’s closing price of $948.92. The three-month LME prices of base metals went mostly in the same direction, Copper closed this week at $8,193.50 per metric ton, 3.40% lower than last week’s close of $8,482.00. Zinc ended the week at $2,327.50 per metric ton, down by 5.04% from its last traded price the week before at $2,451.00. Aluminum finished this week at $2,221.50 per metric ton, lower by 0.54% from last week’s close of $2,233.50. Tin bucked the trend when it closed at $25,895.00 per metric ton this week, gaining 1.35% from last week’s closing price of $25,550.00.              

Energy and Oil

This week, the geopolitical risk premium rose significantly after Israel turned down a ceasefire offer in Gaza and bombed the border city of Rafah. This development makes it increasingly improbable that any de-escalation of tensions in Gaza may materialize in the upcoming weeks. Oil prices have been further buoyed by relatively bearish calls from the U.S. Energy Information Administration pronouncing that U.S. crude output is unlikely to exceed the current level of 13.3 million barrels per day (b/d) until early 2025. Brent is poised to end the week slightly below $82 per barrel.

Natural Gas

For the report week beginning Wednesday, January 31, and ending Wednesday, February 7, 2024, the Henry Hub spot price fell by $0.26 from $2.23 per million British thermal units (MMBtu) to $1.97/MMBtu, the lowest price since June 12, 2023. Regarding the Henry Hub futures price, the price of the March 2024 NYMEX contract decreased by $0.133, from $2.100/MMBtu at the start of the report week to $1.967/MMBtu at the week’s end. This is the lowest settlement price for the March 2024 contract since trading of this contract began 12 years ago. The price of the 12-month strip, averaging March 2024 through February 2025 futures contracts, declined by $0.125 to $2.641/MMBtu.

International natural gas futures price changes were mixed this report week. The weekly average front-month futures prices for liquefied natural gas (LNG) cargoes in East Asia rose by $0.04 to a weekly average of $9.46/MMBtu. Natural gas futures for delivery at the Title Transfer Facility (TTF) in the Netherlands, the most liquid natural gas market in Europe, fell by $0.06 to a weekly average of $9.07/MMBtu. The week last year corresponding to this report week (the week from February 1 to February 8, 2023), the prices were $18.30/MMBtu in East Asia and $17.83/MMBtu at the TTF. The last time early February prices at the TTF averaged below $10/MMBtu was in 2021.

World Market

The pan-European STOXX Europe 600 Index closed with a 0.19% gain on the back of the strong earnings reports of some companies. Gains were curbed, however, by the persistent concern that interest rates may stay higher for longer. Germany’s DAX hardly changed although it remained close to its record high. France’s CAC 40 Index gained by 0.73% while Italy’s FTSE MIB outperformed with a gain of 1,43%. The UK’s FTSE 100 Index lost by 0.56%. Prominent officials of the European Central Bank (ECB) continued to issue warnings against prematurely cutting interest rates. There continue to remain conditions that threaten efforts at inflation control such as sticky services prices, a resilient labor market, and attacks on vessels in the Red Sea that tend to disrupt supply chains. Policymakers want more evidence to support confidence that inflation will eventually settle at the ECB’s target 2% inflation rate.

Over the week, Japan’s stock markets rallied, with the Nikkei 225 Index advancing by 2% and the broader TOPIX rising by 0.7%. The Nikkei reached a 34-year high due to currency weakness that prompted some profit-taking. Gains were also limited as a result of a pullback in expectations that the U.S. Federal Reserve would cut interest rates as early as March. Supportive of investor sentiment, however, were reports of strong foreign investor interest in Japanese stocks in January prompted by a solid earnings reports season. Also driving investor confidence was the recent signal of the Bank of Japan (BoJ) monetary policy continuity even after it exited from its negative interest rate regime. The yield on the 10-year Japanese government bond rose to 0.72% from 0.68% at the end of the previous week as BoJ provided assurances that financial conditions would remain accommodative. These dovish remarks caused the yen to weaken from JPY 148 last week to JPY 149 against the U.S. dollar this week.

During a holiday-shortened week, Chinese stocks rallied in response to the government’s latest series of stimulus measures released to allay concerns about deepening deflation. The Shanghai Composite Index gained by 4.97% and the blue-chip CSI 300 advanced by 5.83% for the four-day trading week. Markets in mainland China remained closed for the Lunar New Year holiday on Friday, February 9, and will continue to remain closed for the next week. Trading at the exchanges will resume on Monday, February 19. The Hong Kong benchmark Hang Seng Index rose by 1.37% for the week. China’s consumer price index fell by 0.8% in January from the prior year period. This is an acceleration from the CPI’s 0.3% drop in December and marks its fastest decline since 2009. Leaning the contraction are food prices, particularly that of pork. Core inflation (which excludes volatile components food and energy costs) rose by 0.4%, its weakest rise since June 2023. The producer price index slipped by 2.5% year-on-year, marking the 16th consecutive month of deflation for factory gate costs. 

The Week Ahead

Among the important economic data scheduled to be released this week are the January housing starts and building permits, the CPI inflation data, and retail sales data.

Key Topics to Watch

  • Monthly U.S. Federal Budget for January
  • Consumer price index for January
  • Core CPI for January
  • CPI year-over-year
  • Core CPI year-over-year
  • Initial jobless claims for February 3
  • Empire State manufacturing survey for February
  • Philadelphia Fed manufacturing survey for February
  • Import price index for January
  • Import price index minus fuel for January
  • U.S. retail sales for January
  • Retail sales minus autos for January
  • Industrial production for January
  • Capacity utilization for January
  • Home builder confidence index for February
  • Housing starts for January
  • Building permits for January
  • Producer price index for January
  • Core PPI for January
  • PPI year-over-year
  • Core PPI year-over-year
  • Consumer sentiment (prelim) for February

Markets Index Wrap-Up

Weekly Market Review – February 3, 2024

Stock Markets

Amid a profusion of significant earnings reports and economic data, the stocks responded with mixed reactions. All major indexes were modestly up for the week but small-cap indexes recorded losses. According to the Wall Street Journal Markets monitor, the Dow Jones Industrial Average gained by 1.43% while the Total Stock Market Index advanced by 1.22%. The broad-based S&P 500 Index climbed by 1.38% but its equally weighted version closed with a moderate loss. The technology-heavy Nasdaq Stock Market Composite moved up by 1.12%, and the NYSE Composite marginally gained by 0.90%. The CBOE Volatility Index, a measure of investors’ risk perception, moved up by 4.45%. Over the past month, the small-cap Russell 2000 Index declined by nearly 4.0%.

Several releases from tech heavyweights drove movements in the major indexes during this, the busiest week of the fourth-quarter earnings reporting season. In response to lower-than-expected earnings guidance from Google parent Alphabet, Microsoft, and chipmaker Advanced Micro Devices, the Nasdaq Composite Index and the S&P 500 Index plunged precipitously on Wednesday. On Thursday, however, the benchmarks recovered much of their losses, buoyed by the stronger-than-anticipated earnings reports from Facebook parent Meta Platforms, Apple, and Amazon.com. Also seeming to sway sentiment was the Federal Reserve policy meeting that concluded on Wednesday. Short-term interest rates were left unchanged by the policy-making body, which broadly aligned with expectations. However, Fed Chair Jerome Powell stated that the Fed was unlikely to cut rates in March, which resulted in futures markets pricing in only 20.5% (from 47.7% one week earlier) of a rate cut at the Fed’s next policy meeting.

U.S. Economy

On Friday, the Labor Department reported that employers added 353.000 new nonfarm jobs in January, double the consensus estimates, at the same time adjusting even higher the gains made in November and December due in part to an annual benchmark revision.  The strong employment report weakened the chances that the Fed will cut interest rates soon, Also surprising on the upside were average hourly earnings which rose by 0.6% and brought the year-over-year increase to 4.6%. Unemployment remained unchanged at 3.7%. However, the average workweek unexpectedly contracted from 34.3 to 34.1 hours. The data was consistent with an upside surprise in job openings reported earlier in the week. December’s job openings rose to their highest level in three months, at 9.03 million.

Some reassuring news on the struggling manufacturing sector also emerged this week.  Revisions to the January gauges of factor activity for both S&P Global and the Institute for Supply Management were released on Wednesday, beating expectations with the former indicating the best (but still moderate) pace of growth in the sector since September 2022. The yield on the benchmark 10-year U.S. Treasury note rose in reaction to Friday’s jobs report but still ended lower for the week. Aside from the modest upside surprise in weekly jobless claims, also possibly exerting some limiting pressure on yields is the lower-than-expected borrowing needs figures reported by the Treasury Department on Tuesday. Furthermore, a relatively light primary calendar and positive flows over the week benefitted the tax-free municipal market.

Metals and Mining

This week, gold and silver continued to defy the odds as they followed the price action pattern established in 2023 that has propelled their prices to record highs. Gold has managed to hold critical support levels, consolidating within a broad-based uptrend despite the Federal Reserve maintaining a restrictive monetary policy that holds the Fed Funds rate at its highest level in nearly two decades. This week, investors received the Fed’s message that the anticipated rate cuts are not going to take place just yet. Despite significant headwinds for metals – the reduced expectations of a rate cut and the S&P 500 and DJIA treading new highs – the April gold futures and rending the week with a close to 1% gain and prices testing resistance around $2,050 per ounce. This shows that there is strength in the physical demand for gold in the marketplace.    

The spot prices for precious metals were mixed for the week. Gold gained 1.05% from its close the previous week at $2,018.52 to its close this week at $2,039.76 per troy ounce. Silver ended lower by 0.48% from its closing price last week of $22.80 to its closing price this week of $22.69 per troy ounce. Platinum ended this week lower by 2.05%, from its price last week of $915.68 to its closing price this week of $896.95 per troy ounce. Palladium ended down by 1.19% from last week’s close at $960.31 to this week’s close at $948.92 per troy ounce. The three-month LME prices of industrial metals were mostly down for the week. Copper came from $8,568.50 last week to $8,482.00 per metric ton this week for a loss of 1.01%.  Zinc began from its closing price last week of $2,580.00 to its closing price this week of $2,451.00 per metric ton for a decline of 5.00%. Aluminum came from its close last week at $2,238.50 to end this week at $2,233.50 per metric ton for a reduction of 0.22%. Tin, which closed last week at $26,648.00, ended this week at $25,550.00 per metric ton for a loss of 4.12%.

Energy and Oil

Market fundamentals took a back seat to speculation this week as oil prices were weighed down by unsubstantiated reports of an impending ceasefire between Israel and Palestine. Brent futures were dragged below $80 per barrel in response to the rumors. Regarding fundamentals, OPEC+ held its ministerial meeting and announced that it was retaining its policy of making no changes to its production policy. Participating top officials indicated that they will meet once more in early March to decide on an extension of the 2.2 million barrels-per-day cuts into the second quarter. With this as background, unforeseen refinery outages in the United States may weaken the U.S. demand further and thus have an even more lasting impact on prices.  

Natural Gas

For the report week from Wednesday, January 24, to Wednesday, January 31, 2024, the Henry Hub spot price fell by $0.21 from $2.44 per million British thermal units (MMBtu) to $2.23/MMBtu. Regarding Henry Hub futures prices, the February 2024 NYMEX contract expired on Monday at $2.490/MMBtu, down by $0.15 from the beginning of the report week. The March 2024 NYMEX contract price decreased to $2.100 /MMBtu, down by $0.16 from the start to the end of the report week. The front-month futures contract price fell after rising above $3.00/MMBtu in the middle of January. The price of the 12-month strip averaging March 2024 through February 2025 futures contracts declined by $0.14 to $2.767/MMBtu.

International natural gas futures price changes were mixed this report week. The weekly average front-month futures prices for liquefied natural gas (LNG) cargoes in East Asia fell by $0.07 to a weekly average of $9.42/MMBtu. Natural gas futures for delivery at the Title Transfer Facility (TTF) in the Netherlands, the most liquid natural gas market in Europe, increased by $0.22 to a weekly average of $9.13/MMBtu. In the week last year corresponding to this report week (the week from January 15 to February 1, 2023), the prices were $19.43/MMBtu in East Asia and $18.04/MMBtu at the TTF.

World Markets

European stocks were directionless this week resulting in the pan-European STOXX 600 Index ending the week roughly flat. Major stock indexes were mixed. While Italy’s FTSE MIB gained 1.11%, France’s CAC 40 Index declined by 0.55%, Germany’s DAX slipped downward by 0.25%, and the UK’s FTSE 100 Index dipped by 0.26%. The yield on the benchmark 10-year German government bond approached a three-week low but returned to end the week unchanged. The UK and Italian government bond yields also dived during the week before recovering lost ground on Friday to end the week slightly higher. On the economic front, the eurozone surprisingly avoided a recession in the last quarter of 2023. During the period, the gross domestic product (GDP) was unchanged relative to the previous three months and was 0.1% higher year-over-year. Annual consumer price inflation continued to proceed in the right direction as the headline rate slowed to 2.8% in January from 2.9% in December. The core inflation rate (excluding the volatile components – food, energy, alcohol, and tobacco prices) likewise inched lower to 3.3%.

Japanese stock markets ascended this past week. The Nikkei 225 Index gained by 1.1% while the broader TOPIX Index rose by 1.7%, mostly due to support lent by a robust corporate earnings season. Higher prices and strong tourism provided a boost to domestically focused firms. The 10-year Japanese government bond (JGB) yield dropped to 0.68% from 0.71% at the end of the previous week. Exerting downward pressure on yields was a surprisingly strong 10-year JGB auction. Regarding currency markets, the yen strengthened to around the high-146 range from the previous low-148 range against the U.S. dollar as the U.S. Federal Reserve dispelled expectations of an interest rate cut in March. Underpinning the yen’s gains are some signs of a hawkish stance by the Bank of Japan (BoJ). On the country’s economy, Purchasing Managers’ Index (PMI) data showed that Japanese manufacturing conditions deteriorated modestly in January, with continued falls in output and new orders. Over the month, managers also faced a steep rise in price pressures as cost burdens rose at a marked pace amid high raw materials, labor, and fuel prices.

In China, stocks retreated in the face of discouraging economic data and property sector headlines, fueling investors’ pessimism surrounding the growth outlook. The Shanghai Composite Index saw its worst week since 2018 as it plummeted by 6.19%. The blue-chip CSI 300 plunged by 4.63%, its biggest weekly loss since 2022. Both indexes are trading at their lowest levels in five years. The Hong Kong benchmark Hang Seng Index declined by 2.62%. A mixed picture of China’s economy was reflected in January’s economic data. The official Manufacturing Purchasing Managers’ Index (PMI) ascended to 49.2 in January from 49,0 in December amid improved production growth. However, this figure still lagged the 50-mark threshold that distinguished expansion from contraction. The non-manufacturing PMI is well into expansion territory as it registered an above-consensus 50.7 from 50.4 in December. By comparison, the private Caixin/S&P Global Survey of manufacturing activity held steady at 50.8 in January, exceeding expectations and marking its third straight month of expansion. Meanwhile, the value of new home sales by China’s top 100 developers fell by 34.2% year-on-year in January. This is roughly even with the 34.6% drop in December, according to the China Real Estate Corporation. The report shows no sign of improvement in China’s property crisis. Falling home prices and construction delays continue to sideline buyers, in turn increasing pressure on indebted property developers and leading Beijing to intervene to prop up the sector.        

The Week Ahead

Included among the important economic data scheduled for release in the coming week are the ISM service PMI reading, consumer credit data, and the U.S. trade deficit.

Key Topics to Watch

  • S&P Final U.S. services PMI for January
  • Chicago Fed President Austan Goolsbee TV appearance
  • ISM services for January
  • Atlanta Fed President Raphael Bostic gives welcoming remarks
  • Cleveland Fed President Loretta Mester speaks
  • Minneapolis Fed President Neel Kashkari speaks
  • Boston Fed President Susan Collins speaks (Tuesday, Feb, 6)
  • Philadelphia Fed President Patrick Harker speaks
  • U.S. Trade deficit for December
  • Fed Gov. Adriana Kugler speaks
  • Boston Fed President Susan Collins speaks (Wednesday, Feb. 7)
  • Richmond Fed President Tom Barkin speaks (Wednesday, Feb. 7)
  • Fed Gov. Michelle Bowman speaks
  • Consumer credit for January
  • CBO briefing on budget and economic outlook
  • Initial jobless claims for February 3
  • Wholesale inventories for December
  • Richmond Fed President Tom Barkin speaks (Thursday, Feb. 8)
  • CPI seasonal factor revisions
  • Dallas Fed President Lorie Logan speaks

Markets Index Wrap-Up
Weekly Market Review – January 27, 2024

Stock Markets

It was a week of gains for stocks, albeit moderate. The Dow Jones Industrial Average (DJIA) modestly rose by 0.65% while the DJ Total Stock Market Index rose by a heftier 1.08% although utilities underperformed the other sectors, slipping by 0.32%. The broader S&P 500 Index closely mirrored the Total Stock Market, advancing by 1.06%. The technology-heavy Nasdaq Stock Market Composite gained by 0.94% and the NYSE Composite climbed by 1.31% with all Russell Indexes up. The CBOE Volatility Index (VIX), an indicator of investor risk perception, moved slightly downward by 0.30%.

 The DJIA and the S&P 500 climbed to new all-time highs; for the latter, this marked the 12th weekly advance out of the last 13 weeks. Overall gains were modest but relatively broad. The small-cap Russell 2000 Index remained almost 20% below its all-time intraday high. Investors’ attention focused on the growing stream of fourth-quarter earnings reports this week, given the lack of comments or speeches by Federal Reserve Officials ahead of the upcoming policy meeting. Included among the stocks that moved the market was Tesla, which plunged sharply after it missed both earnings and revenue estimates. Tesla also warned of slower growth in 2024. On the other hand, Netflix charted solid gains attributable to an unexpected increase in subscribers.

U.S. Economy

Over the week, the economic calendar was light, although two economic reports revealed data that continue to support the argument for a soft landing in the U.S. First, the S&P PMI data for both services and manufacturing indicated that these sectors were expanding in January, if barely. Second, fourth-quarter GDP growth came in at 3.3% and exceeded analysts’ expectations of a 2.0% growth rate. These data may be backward-looking, however, they continue to solidify the upward economic trend and confirm that the U.S. economy was not softening as the new year began. On the contrary, economic growth was seen to accelerate at the end of 2023. Furthermore, inflation showed signs of moderation at the same time the economy was strengthening.

Other developments worth mentioning include the 0.3% increase in December in the orders for nondefense capital goods excluding aircraft, which is widely considered as a proxy for business investment. The economy grew by 2.5% over the year as a whole, an increase from the 2022 growth rate of 1.9%. The core personal consumption expenditure (PCE) price index, which is the Fed’s preferred inflation metric, advanced by 2.0% year-on-year in the fourth quarter, in line with expectations and the Fed’s long-term target. Financial markets should be broadly supported by the “Goldilocks” outcome, referring to the better-than-expected growth simultaneous with easing inflation. Some downward pressure on interest rates should be evident at this point.

Metals and Mining

Gold investors face a challenging environment with the Federal Reserve continuing to chart a course that makes it difficult for the precious metal to gain bullish momentum. The most recent economic data suggests that while falling inflation may provide the Fed room to cut interest rates, the general economic health does not require them to. Gold is struggling to maintain its current levels, partly due to the report by the U.S. Commerce Department that personal consumption increased by 0.7% in December, significantly higher than expected. This confirms the trend suggested by previous data that retail sales activity was robust during the holiday season. However, one worrying aspect of the recent economic growth trend is that it is mostly funded by debt, bolstered by buy-now-pay-later schemes. This is unsustainable. Economists and analysts note that this is the final stage of consumption because consumers have burned through their earnings and inflation continues to erode their purchasing power. The value of holding safe-haven assets such as gold and silver may presently elude most investors, however, for those who are patient, these are the times that present the best opportunities.

The spot prices of precious metals were mixed for the week. Gold lost by 0.54%, dipping from its previous weekly close at $2,029.49 to this week’s close at $2,018.52 per troy ounce. Silver, on the other hand, rose by 0.80%, bringing its weekly close from last week’s $22.62 to this week’s $22.80 per troy ounce. Platinum gained by 1.37% from last week’s closing price of $903.27 to this week’s closing price of $915.68 per troy ounce. Palladium also gained, closing 1.02% higher from last week’s closing price of $950.61 to end this week at $960.31 per troy ounce. The three-month LME prices for base metals were generally up for the week. Copper gained by 2.60%, from the previous week’s price of $8,351.00 to this week’s price of $8,568.50 per metric ton. Zinc climbed by 4.79%, from its previous weekly close at $2,462.00 to the recent week’s close at $2,580.00 per metric ton. Aluminum realized a 3.35% gain, from last week’s close at $2,166.00 to this week’s close at $2,238.50 per metric ton. Tin advanced by 5.34% from last week’s close at $25,298.00 to end this week at $26,648.00 per metric ton.

Energy and Oil

Oil prices were boosted this week to their highest level for the year by the release of stronger-than-expected performance in the U.S. economy. The announcement of a 3.3% GDP growth for the fourth quarter surprised many analysts and investors. The bullish cause gained added momentum as a result of continuous Houthi strikes in the Red Sea and surging product freight rates. The White House has asked for China’s help to rein in the Houthi rebels attacking commercial tankers plying the Red Sea after two Maersk container ships were targeted this week despite the presence of U.S. warship escorts. China has been reaching out to Iran in an attempt to prevent further Yemeni attacks, but this has failed to ease geopolitical tensions. This week, Brent broke through the $80 per barrel threshold and reached $82 per barrel, which is sufficient for a major psychological price barrier to be overcome. This is a technical signal that oil prices may be expected to reach higher levels.

Natural Gas

For the report week that began Wednesday, January 17, and ended Wednesday, January 24, 2024, the Henry Hub spot price fell by $0.43 from $2.87 per million British thermal units (MMBtu) to $2.44/MMBtu. Regarding Henry Hub futures, the price of the February 2024 NYMEX contract decreased by $0.229, from $2.870/MMBtu at the beginning of the week to $2.641/MMBtu by the end of the report week. The price of the 12-month strip averaging February 2024 through January 2025 futures contracts declined by $0.145 to $2.815/MMBtu. International natural gas futures decreased this report week. The weekly average front-month futures prices for liquefied natural gas (LNG) cargoes in East Asia fell by $1.01 to a weekly average of $9.49/MMBtu. Natural gas futures for delivery at the Title Transfer Facility (TTF) in the Netherlands, the most liquid natural gas market in Europe, decreased by $0.71 to a weekly average of $8.92/MMBtu. In the week last year that corresponds to this report week (the week from January 18 to January 25, 2023), the prices were $22.42/MMBtu and $19.67 /MMBtu in East Asia and at the TTF, respectively.

World Markets

The pan-European STOXX Europe 600 Index closed the week higher by 3.11% on the back of encouraging corporate results and announcement of additional stimulus measures by China. Also contributing to improved market sentiment was the dovish outlook signaled by the European Central Bank (ECB) by leaving interest rates unchanged. Most major indexes in the region climbed. France’s CAC 40 Index surged by 3.56%, Germany’s DAX jumped by 2.45%, and Italy’s FTSE MIB advanced by 0.32%. The FTSE 100 Index of the U.K. climbed by 2.32%. Simultaneously, the European government bond yields declined. The yield on the benchmark 10-year German bond dipped as did the French and Swiss sovereign bonds of the same maturity. The ECB retained its key interest rates at the same level at record highs and repeated that it would continue to enforce its strict monetary policy “at sufficiently restrictive levels for as long as necessary” to bring inflation under control until it reaches the 2% target. The central bank stressed, however, that policy decisions would continue to be guided by economic and financial data as they develop.

Japanese equities declined this week. The Nikkei 225 Index fell by 0.6% while the broader TOPIX Index dropped by 0.5%. The Bank of Japan (BoJ) retained its ultra-accommodative stance and its forward guidance. However, Governor Kazuo Ueda emphasized the BoJ’s progress toward achieving sustained inflation, which raised expectations that a monetary policy shift is within sight. These hopes were somewhat tempered later in the week by a softer-than-forecasted Tokyo area inflation reading, a leading indicator for nationwide price trends. Influenced by ongoing speculation regarding the impending end of Japan’s negative interest rate policy, the yield on the 10-year Japanese government bond (JGB) rose to 0.71% from 0.66% at the end of the week previous. The yen strengthened to the high JPY 147 range from about JPY 148 the week before.  

 Chinese stocks rose after Beijing announced the implementation of forceful stimulus measures in support of the economy. The Shanghai Composite Index advanced by 2.75% while the blue-chip CSI 300 Index rose by 1.96%. The Hong Kong benchmark Hang Seng Index surged by 4.2%. The People’s Bank of China (PBOC) announced a cut in its reserve ratio requirement (RRR) by 0.50% or 50 basis points for most banks. The RRR cut will take effect on February 5 and shall mark the first cut in banks’ reserve this year. The bank also announced that it will lower interest rates by 0.25% or 25 basis points for refinancing and rediscounting beginning January 25, to support agriculture and small businesses. In 2023, the PBOC cut the RRR twice, the last cut being in September. After the PBOC kept its medium-term lending rates unchanged the week prior, Chinese banks maintained their one- and five-year loan prime rates at current rates, as expected. In other developments, regulators lifted the draft rules imposed on online games in late December, aimed at curbing spending and rewards. When they were first announced, the regulations eliminated almost US$80 billion in market value from some of China’s largest gaming companies due to investors fearing the likelihood of another crackdown on the sector.

The Week Ahead

Among the important economic data expected to be released this week are the results of the FOMC meeting and labor market data (nonfarm payrolls report, unemployment rate, and hourly wages for January).

Key Topics to Watch

  • S&P Case-Shiller home price index (20 cities) for November
  • Job openings for December
  • Consumer confidence for January
  • ADP employment for January
  • Employment Cost Index for the Fourth Quarter
  • Chicago Business Barometer (PMI) for January
  • Fed interest rate decision
  • Initial jobless claims for Jan. 27
  • U.S. Productivity for the Fourth Quarter
  • S&P U.S. manufacturing PMI (final) for January
  • ISM manufacturing
  • U.S. nonfarm payrolls for January
  • U.S. unemployment rate for January
  • U.S. hourly wages for January
  • Hourly wages year-over-year
  • Factory orders for December
  • Consumer sentiment (final) for January

Markets Index Wrap-Up

Weekly Market Review – January 20, 2024

Stock Markets

Thus far, despite a strong and optimistic start, markets in this new year have been subdued. Not surprisingly, this may be a technical consolidation after the very strong rally that took place in the final weeks of 2023. According to the Wall Street Journal (WSJ) Markets report, the Dow Jones Industrial Average (DJIA) gained by 0.72% while the Dow Jones Total Stock Market Index rose by 1.03%. The broad S&P 500 Index advanced by 1.17% and the technology-heavy Nasdaq Stock Market Composite surged ahead by 2.26%. The NYSE Composite went against the grain and instead declined by 0.42%. The CBOE Volatility (VIX) Index, which tracks investor risk perception, rose by 4.72%.  

Beneath the surface, some segments of the market, including the broader equal-weight S&P 500, small-cap stocks, and investment-grade bonds, appear to have come under some pressure in the first few weeks of 2024. Some sectors continue to remain more resilient such as technology and communication services, however, some defensive sectors, such as health care and consumer staples, continue to outperform. For the holiday-shortened week just ended (markets were closed on Monday in commemoration of Martin Luther King, Jr. Day), information technology stocks outperformed due to a rally in semiconductor shares. Particularly strong was artificial intelligence (AI) chip maker NVIDIA and its rival, Advanced Micro Devices (AMD). The fourth-quarter earnings reporting season is just beginning, with results from only 23 companies in the S&P 500 expected to be released in the coming week. Last Tuesday, shares of DJIA component Boeing plunged sharply following an analyst downgrade warning of possible delivery delays should regulators uncover more safety issues related to the company’s 737 MAX airliners. However, the stock recovered most of its decline towards the end of the week.

U.S. Economy

Investors demonstrated some uncertainty about the economy’s health when an index of manufacturing activity in the New York region took a dive and surprised on the downside, although these concerns later abated in the week. On the other hand, the retail sales numbers for December that were released on Wednesday exceeded expectations and suggested that consumption in the economy remained on solid footing, Retail sales climbed by 0.6% in October with online sales expanding by 1.5% to hit a new record peak. On Friday, a preliminary report issued by the University of Michigan showed a jump in its January index of consumer sentiment to reach its highest level in almost three years and by the most since 2005. This index also rose over the past two months by the greatest margin since 1991, suggesting that consumers believe that the uptrend in inflation has truly reversed.

Metals and Mining

The uncertainty in the direction the Federal Reserve will take regarding rate hikes (or cuts) will continue to dominate the financial markets and gold, in particular. Investors’ expectations of a potential rate cut have been sharply pared back by healthy economic data released this week, The data showed that holiday spending during December was highly robust, signaling that consumers continue to remain resilient to persistent inflation as well as the aggressive tightening policy of the Federal Reserve. This trend could continue, based on the results of the preliminary consumer sentiment survey by the University of Michigan showing that consumer sentiment rose to its highest level since July 2021. Simultaneously, one-year consumer inflation expectations have returned to pre-pandemic levels. These conditions do not suggest a bull market for gold anytime soon since investors expect that soft economic growth may force the Fed to cut interest rates despite inflation remaining above the 2% target.

Over the week, the spot price of precious metals modestly descended. Gold, priced at $2,049.06 at the end of the week prior, closed at $2,029.49 per troy ounce this week for a decline of 0.96%. Silver, which closed at $23.19 last week, ended this week at $22.62 per troy ounce, dipping by 2.46%. Platinum, the former weekly of which was at $911.64, closed this week at $903.27 per troy ounce for a drop of 0.92%. Palladium, which closed at $977.83 one week ago, ended at $950.61 per troy ounce this week for a loss of 2.78%.  The three-month LME prices for industrial metals ended the week mixed. Copper came from its closing price one week ago of $8,339.00 to close this week at $8,351.00 per metric ton for a modest gain of 0.14%. Zinc, which closed one week ago at $2,514.00, ended this week at $2,462.00 per metric ton for a slide of 2.07%. Aluminum closed last week at $2,219.50 and this week at $2,166.00 per metric ton to lock in a loss of 2.41%. Tin, which closed one week ago at $24,631.00, closed this week at $25,298.00 per metric ton, gaining 2.71%.

Energy and Oil

The conflict in the Middle East which began with the Hamas invasion of Israel has escalated, with Pakistan and Iran now exchanging missile attacks and further intensifying the geopolitical risk in the region. In addition, the cold snap in the U.S. has shut in a significant portion of Bakken output in what became the first U.S. supply disruption in many months. Exacerbating the effect of these supply concerns, an improvement in the demand sentiment is further contributing to the upward pressure on oil prices. The International Energy Agency (IEA) has adjusted its 2024 demand figure upward for the third time in a row to 1.24 million barrels per day (b/d). As a consequence, Brent has approached within range of the $80 per barrel mark before falling slightly back toward the $79 level. In the meantime, OPEC published its first monthly market report for the year. In the report, the group divulged its expectation that global oil demand growth would slow down to 1.85 million b/d but left its 2024 demand increase unchanged at 2.25 million b/d.

Natural Gas

For the report week from Wednesday, January 10, to Wednesday, January 17, 2024, the Henry Hub spot price fell by $0.36 from $3.23 per million British thermal units (MMBtu) to $2.87/MMBtu. The Henry Hub price reached a high of $13.08/MMBtu on Friday, the highest daily closing price since February 2021, indicating a run-up in prices observed across the country for that day. For the Henry Hub futures, the price of the February 2024 NYMEX contract decreased by $0.169, from $3.039/MMBtu at the start of the report week to $2.870/MMBtu at the week’s end. The price of the 12-month strip averaging February 2024 through January 2025 futures contracts declined by $0.048 to $2.960/MMBtu.

International natural gas futures prices decreased this report week. The weekly average front-month futures prices for liquefied natural gas (LNG) cargoes in East Asia fell by $0.93 to a weekly average of $10.51/MMBtu. Natural gas futures for delivery at the Title Transfer Facility (TTF) in the Netherlands, the most liquid natural gas market in Europe, decreased by $0.72 to a weekly average of $9.62/MMBtu, the first time averaging below $10.00/MMBtu since mid-summer. By comparison, in the week last year that corresponds to this report week (the week from January 11 to January 18, 2023), the prices were $24.85/MMBtu in East Asia and $20.10/MMBtu at the TTF.

World Markets

In Europe, stocks headed lower for the week. The pan-European STOXX Europe 600 Index ended the week 1.58% lower due primarily to comments from central bank policymakers that caused markets to scale back expectations that interest rates will soon be reduced. The major stock indexes in the region ended mostly softer. Italy’s FTSE MIB slid lower by 0.61%, Germany’s DAX descended by 0.89%, and France’s CAC 40 Index dropped by 1.25%. The UK’s FTSE 100 Index declined by 2.14%. Also ending the week down were European government bonds (when bond yields rise, prices of existing bonds fall). The yield on Germany’s two-year sovereign note rose to more than 2.7%, while the yield on Italy’s two-year note climbed to 3.2%. In the U.K., the yield on the two-year gilt increased to 4.2% after data indicated that inflation had risen, dampening hopes that interest rates would soon be reduced.

Japan’s stock markets rose over the week as the yen’s weakness drove stronger performance among exporters. The Nikkei 225 Index gained by 1.1% to reach a 34-year high while the broader TOPIX Index inched up by 0.6%. Other signs that inflationary pressure was easing further dampened expectations among investors regarding any shift in the monetary stance of the Bank of Japan (BoJ) at its meeting scheduled for January 22-23. The possibility that Japan’s central bank may exit its negative rates policy soon has already been reduced due to the economic impact of the deadly Noto Peninsula earthquake on New Year’s Day. In reaction to the dissipation of hopes of an imminent interest rate hike in Japan, the yen weakened to about JPY 148 against the U.S. dollar from its high-144 range in the prior week. In a further reaction to the more hawkish tone adopted by the U.S. Federal Reserve officials, the yield on the 10-year Japanese government bond rose to 0.66% from 0.59% at the end of the previous week.

Chinese stocks fell in reaction to the latest indicators which highlighted the country’s weak economic outlook. The Shanghai Composite Index dropped by 1.72%, its eighth drop in the past nine weeks. The Shanghai Composite is popular among domestic investors and the index they refer most to in tracking the markets. The blue-chip CSI 300 lost 0.44%, its ninth-weekly drop in ten weeks. Hong Kong’s benchmark Hang Seng Index plummeted by 5.76% for the week. China’s GDP was reported to have expanded in the final quarter over last year, meeting the official annual growth target of Beijing. The economy grew by a quarterly rate of 1.0% compared to the 0.8% third-quarter growth. The quarterly growth readings provide a better picture of China’s underlying economic expansion than the year-on-year growth rates because major cities were still under pandemic lockdown in 2022, the base year. Other data have nevertheless underscored pockets of weakness in China’s economy. Retail sales grew by a lower-than-expected 7.4% in December year-on-year, down from a 10.1% increase in November. Amid higher infrastructure growth, fixed-asset investment expanded by an above-forecast 3.0% for the full year, although there was a deeper decline in real estate investment. Industrial production rose more than expected in December from one year ago; however, urban unemployment rose to 5.1% from 5.0% in November.

The Week Ahead

Among the important economic data scheduled to be released this week are the fourth-quarter gross domestic product (GDP) results and personal consumption expenditure (PCE) inflation.

Key Topics to Watch

  • U.S. leading economic indicators for December
  • S&P flash U.S. services PMI for January
  • S&P flash U.S. services manufacturing PMI for January
  • Fourth-quarter GDP (prelim)
  • Initial jobless claims for January 20
  • Durable goods orders for December
  • Durable goods minus transportation for December
  • Advanced U.S. trade balance in goods for December
  • Advanced retail inventories for December
  • Advanced wholesale inventories for December
  • New home sales for December
  • Personal income for December
  • Personal spending for December
  • PCE Index for December
  • Core PCE Index for December
  • PCE (year-over-year)
  • Core PCE (year-over-year)
  • Pending home sales

Markets Index Wrap-Up

Weekly Market Review – January 13, 2024

Stock Markets

All the major stock indexes ended higher for the week. The Dow Jones Industrial Average (DJIA) realized a modest gain of 0.34% while its Total Stock Market rose by 1.70% for the week. The broad S&P 500 Index advanced by 1.84%. Meanwhile, the technology-heavy Nasdaq Stock Market Composite surged ahead by 3.09%, outperforming the DJIA, the S&P 500, and the NYSE Composite which inched up by 0.25%. The CBOE Volatility Index (VIX), which measures investor risk perception, dipped by 4.87%. Large-cap growth stocks outperformed the broader market as did the Nasdaq technology stocks. Friday this week was the unofficial end of the earnings season, with the country’s four largest banks (Citigroup, Bank of America, JPMorgan Chase, and Wells Fargo) reporting fourth-quarter results on that day.

Stocks showed some weakness on Thursday morning when the Labor Department released the consumer price inflation data, indicating that investors were closely watching inflation results. While the CPI was slightly higher than expected, core CPI (excluding food and energy) was in line with consensus estimates. For the whole of 2023, core CPI rose by 3.9%, the slowest 12-month pace since mid-2021. Markets will remain closed in the coming Monday in observance of Martin Luther King, Jr. Day.  

U.S. Economy

While consumer price inflation was moderately troubling, the produce price data released on Friday was more encouraging. The headline wholesale prices receded by an additional 0.1% in December, the third straight month that they declined. PPI rose 0.1% while core PPI rose by 1.8% for the whole of 2023, lower than expected and below the overall inflation target set by the Federal Reserve at 2.0%. With the start of the New Year, the labor market appeared to be in a healthy condition. Some 202,000 workers filed for unemployment benefits in the first week of January, according to reports by the Labor Department. This figure is well below expectations, as well as the lowest since mid-October. The report also indicated that 1.83 million filed continuing claims, likewise the lowest since October.

This week also saw the release of two surveys that indicated that consumers and small business owners remained wary concerning the economic outlook, although to a lesser degree than in recent months. Among investors, the rise in optimism seemed palpable which is likewise reflected in the strong performance of the stock market in December. Despite small business owners remaining pessimistic, the NFIB Small Business Optimism Index still rose more than expected and hit its highest level since July. The yield on the benchmark 10-year U.S. Treasury note fell back below 4% over the week, indicating that fixed-income investors were mostly unmoved by the modest upside performance in the consumer inflation data.

Metals and Mining

The gold market remains strong in the opening weeks of the new year as geopolitical uncertainties in the Middle East continued to provide demand for safe-haven assets. The recent interest in the approval of a Bitcoin ETF, while making waves, is not foreseen to make a strong impact on the gold market, unlike its effect in 2021. It became evident in the last two years that when uncertainty is high, investors return to investments that they can hold and have tangible value. Compared to cybercurrencies, gold is an investment with thousands of years of history as a reliable store of wealth. Although demand may be sluggish central banks continue to accumulate gold almost as quickly as it is mined out of the ground. The People’s Bank of China began buying gold in December and just this past week bought nine tons of this precious metal.

This week, the spot prices of precious metals generally moved sideways. Gold gained 0,18% from its closing price last week of $2,045.45 to close this week at $2,049.06 per troy ounce. Silver neither moved up nor down, remaining at its price last week of $23.19 per troy ounce. Platinum slid by 5.45% from its price in the previous week of $964.18 to its closing price this week of $911.64 per troy ounce. Palladium lost 5.12% of its previous week’s closing price of $1,030.56 to end this week at $977.83 per troy ounce. The three-month LME prices of industrial metals were mostly down. Copper came down by 1.47% from its closing price one week ago at $8,463.00 to its closing price this week at $8,339.00 per metric ton. Zinc lost 1.89% of its last price in the previous week of $2,562.50 to end this week at $2,514.00 per metric ton. Aluminum ended lower by 2.38% from its previous week’s close at $2,273.50 to end this week at $2,219.50 per metric ton. Tin remained hardly changed, inching up by 0.04% from its close a week ago at $24,622.00 to its close this week at $24,631.00 per metric ton.

Energy and Oil

Multiple tankers were prompted to divert from the Suez Canal, with Danish shipping company Torm joining the ranks of European companies currently avoiding the Red Sea transits. This continued as the tensions in the region escalated, culminating with the largest US/UK attack on Houthi positions since the start of Operation Prosperity Guardian. The militaries of the United States and the United Kingdom embarked on joint strikes against Houthi militant targets in Yemen. Targets of the assault were radars as well as missile and drone-launching sites of the terrorist group, prompting a call from Saudi Arabia for restraint in the Red Sea area. As a consequence, for the first time in 2024, ICE Brent futures have traded above the $80 per barrel mark. The upside in oil, and possibly even more so for gas, appears to be far from over as the shipping industry tilts towards a blanket ban on all transits through the Bab el Mandeb Strait.

Natural Gas

For the report week beginning Wednesday, January 3, to Wednesday, January 10, 2024, the Henry Hub spot price rose by $0.63 from $2.60 per million British thermal units (MMBtu) to $3.23/MMBtu. The closing Wednesday was the second consecutive day that the Henry Hub was above $3.20/MMBtu. The last time the Henry Hub price was at $3.00/MMBtu or above for more than one day was in early November 2023. Regarding Henry Hub futures prices, the price of the February 2024 NYMEX contract increased by $0.371, from $2.668/MMBtu at the start of the report week to $3.039 at the end of the week. The price of the 12-month strip averaging February 2024 through January 2025 futures contracts rose by $0.142 to $3.008/MMBtu, with higher prices next winter driving up the 12-month average. The January 2025 futures contract advanced to higher than $4.00/MMBtu on January 9, which is significantly higher than futures prices for all other months in the strip.

For this report week, international natural gas futures prices decreased. The weekly average front-month futures prices for liquefied natural gas (LNG) cargoes in East Asia fell by $0.12 to a weekly average of $11.44/MMBtu. Natural gas futures for delivery at the Title Transfer Facility (TTF) in the Netherlands, the most liquid natural gas market in Europe, decreased by $0.03 to a weekly average of $10.35/MMBtu. In the week last year corresponding to this report week (for the week starting January 4 and ending January 11, 2023), the prices were $27.67/MMBtu in East Asia and $22.02/MMBtu at the TTF.

World Markets

The lack of any strong indications as to where interest rates are headed brought little activity to European stocks over the week. The pan-European STOXX Europe 600 Index ended the week practically unchanged as traders weighed the likelihood of interest rates staying higher for longer than they expected. Major stock indexes were mixed but the German DAX, French CAC 40 Index, and Italian FTSE MIB registered modest gains. The UK’s FTSE 100 Index dipped by 0.84%. European government bond yields were volatile for the week, due to dovish comments made by policymakers at the European Central Bank (ECB) being offset by moderating market expectations that an interest rate cat will materialize soon. Germany’s benchmark 10-year government bond yield closed the week close to 2.2%, while in the UK, the yield on the benchmark 10-year government bond inched upward in response to November data showing Britain’s economy grew slightly more than expected.

In Japan, strong gains were registered in the stock markets after a holiday-shortened week that opened on Tuesday. The Nikkei 225 Index surged by 6.6% while the broader TOPIX Index jumped by 4.2%. The indexes rallied to their highest levels in almost 34 years, bolstered by the continuation of highly stimulative monetary policy and weakness in the yen that boosted Japan’s exports. The yen hovered at its lowest levels in a month, softening beyond JPY 145 against the U.S. dollar. Hot U.S. inflation reports reduced expectations regarding the time it would take before the Federal Reserve would decide to cut interest rates. The yield on the 10-year Japanese government bond (JGB) held at around 0,6% during the week as it searched for a clear direction.

Chinese stocks descended after data revealed that China’s deflationary cycle continued into December and raised expectations of increased government support in 2024. The Shanghai Composite Index dropped by 1.61% while the blue-chip CSI 300 fell by 1.35%. The Hong Kong benchmark Hang Seng Index declined by 1.76%. The country’s CPI fell by 0.3% year-on-year in December. This is the third monthly decline, coming from November’s 0.5% dip as food prices were weighed down by lower pork prices. The producer price index fell by 2.7% from one year ago compared with November’s 3% decline, marking the 15th monthly reduction. The most recent inflation data raised some analysts’ expectations that China’s central bank may lower its key policy rate and infuse the financial system with more cash at its next policy meeting, on concerns that the economy may succumb to sustained deflation. In the meantime, China’s exports rose by a better-than-expected 2.3% year-on-year in December, following 0.5% growth in November.     

The Week Ahead

Among the important economic data scheduled to be released in the coming week are retail sales and building permits for December. as well as industrial production and capacity utilization for the same month.

Key Topics to Watch

  • Empire State manufacturing survey for January
  • Fed Gov. Christopher Waller speaks
  • Import price index for December
  • Import price index minus fuel for December
  • U.S. retail sales for December
  • Retail sales minus autos for December
  • Fed Vice Chair for Supervision Michael Barr speaks (Jan. 17)
  • Gov. Michelle Bowman speaks
  • Industrial production for December
  • Capacity utilization for December
  • Business inventories for November
  • Fed Beige Book
  • New York Fed President John Williams delivers opening remarks
  • Atlanta Fed President Raphael Bostic speaks
  • Initial jobless claims for Jan. 13
  • Philadelphia Fed manufacturing survey for January
  • Housing starts for December
  • Building permits for December
  • Consumer sentiment (prelim) for January
  • Existing home sales for December
  • Fed Vice Chait for Supervision Michael Barr speaks (Jan. 19)
  • San Francisco Fed President Mary Daly speaks

Markets Index Wrap-Up

Weekly Market Review – January 6, 2024

Stock Markets

The major stock market indexes were generally down in the week just concluded, partly as a correction following the S&P’s nine-week winning streak, while interest rates moved higher. The WSJ Markets Report shows the Dow Jones Industrial Average (DJIA) slipped by 0.59% and the DJ Total Stock Market Index fell by 1.79%. The broad-based S&P 500 Index marginally dipped by 1.52% while the technology-tracking Nasdaq Stock Market Composite fell by more than twice as much at 3.25% down. The NYSE Composite is slightly lower than the week before by 0.56%, and the Russell Indexes indicate that the correction has affected both small and large-cap stocks. The CBOE Volatility Index (VIX), the investor risk perception indicator, rose by 7.23%.

The moderate sell-off can be attributed to some repositioning that was bound to happen at the start of a new trading year. After all, the markets rallied by 16% during the last two months of 2023 and some profit-taking can only be expected. The new year’s performance may be significantly affected by two primary forces: the interest-rate decisions that the Federal Reserve will be making and the economy’s glide path, both of which ought to be favorable this year. There is some vulnerability, however, in possible surprises on the downside compared to the rosy expectations (referred to as the Goldilocks outcomes, neither too hot nor too cold) for 2024, thus some volatility is likely.

U.S. Economy

Optimism about the economy generally hinges on the strength in the labor market which has proven to be resilient over the post-pandemic recovery period. The Goldilocks scenario is one in which the economy relies on growth in consumer spending and corporate profits to soften the prospects of a possible recession on the heels of the highest rate cuts to mitigate the highest inflation rates in recent history. The easing and possible reversal of the Fed’s rate hike policies should come about by a slowdown in the pace of consumer spending. The labor market is a key determinant of the path of household consumption.

The latest employment report shows that the jobs market retains its resilience, having created a better-than-expected total of 216,000 jobs in December, and the unemployment rate is holding steady at a healthy 3.7%. Despite the strong hiring trend of last month, it is more likely that the labor market will bend, but not break, as 2024 progresses. We may expect a slowdown in the pace of job gains and a moderate increase in the unemployment rate; these are healthy signs. Job openings last December remain robust as it continues to shrink. This development ought to prompt restraint in consumer spending compared to the last two years, without retreating into hibernation that may cause a full-blown recession.

Metals and Mining

Aluminum production was impacted by the power crunch in Europe and Mexico. As a result, prices were driven upward by more than 40% for a second straight year of gains. It, however, also affected the demand for iron ore as China, the world’s largest steel producer, cut output. Iron ore prices crashed in the second semester of 2023 after hitting record peaks in May, as China implemented strict output curbs. Moving forward, base metals are expected to outperform as energy transition will drive demand while supply chain bottlenecks may persist,

The spot price for precious metals came down over the recent week. Gold moderately fell by 0.85% from its previous week’s closing price of $2,062.98 to this week’s closing price of $2,045.45 per troy ounce. Silver slid by 2.56% from its week-ago close at $23.80 to its close this week at $23.19 per troy ounce. Platinum underwent a similar correction as that of silver, dropping by 2.79% from its week-ago close at $991.90 to finish at $964.18 per troy ounce this week. Palladium declined by 6.33% from its close last week at $1,100.24 to end this week at $1,030.56 per troy ounce. The three-month LME prices of base metals followed a similar trend as those of precious metals. Copper corrected by 1.12% from its close last week at $8,559.00 to its close this week at $8,463.00 per metric ton. Zinc fell by 3.59% from its ending price one week ago at $2,658.00 to its ending price this week at $2,562.50 per metric ton. Aluminum gave way by 4.64% from its close last week at $2,384.00 to this week’s close at $2,273.50 per metric ton. Tin lost 3.12% from its closing price one week ago of $25,415.00 to its closing price this week of $24,622.00.

Energy and Oil

Oil rose by 4% midweek due to Houthi militant action in the Red Sea despite U.S. warnings, as well as OPEC’s pledge to support prices.  The price of oil will finish the week with a slight gain due to tensions in the Middle East accounting for recouping losses after US inventory data. A hefty 5.5 million crude stock draw, which was attributable to the typical year-end clearing of inventory to minimize ad valorem inventory taxes, caused an immediate market reaction in the form of a modest decline after both diesel and gasoline posted huge stock builds. Houthi attacks in the Red Sea persisted, however, as well as the worsening confrontation between Israel and Iran, which limited the pricing downside with Brent trading around $76 per barrel.  

Natural Gas

The U.S. became the world’s leading liquefied natural gas exporter as the country’s LNG exports hit monthly and annual record highs in December. 8.6 million tons were shipped by the U.S. last month, bringing the annual total to 88.9 million tons, an increase of 15% from the previous year.

World Markets

The pan-European STOXX Europe 600 Index ended the week down 0.55% which ended seven consecutive weekly gains as the optimism for an early interest rate cut in the new year began to wane. Most of the major stock indexes fell, among which are France’s CAC 40 Index which lost by 1.62%, and Germany’s DAX which gave up 0.94%. Bucking the trend was Italy’s FTSE MIB which managed to squeeze out a 0.29% increase. Joining the losers was the UK’s FTSE 100 Index which slipped by 0.56%. As traders tempered their expectations for an aggressive rate cut, European government bonds fell sharply which sent yields higher. In Italy, the 10-year government bond yield closed the week above 3.8% while the yield on the benchmark 10-year German bund rose to more than 2.1%. The 10-year gilt in the UK ended with an almost 3.8% yield. The resumption in the acceleration of eurozone inflation in December appeared to dash hopes for early rate cuts by the European Central Bank.

Over a New Year’s holiday-shortened week where trading resumed only on Thursday, Japan’s stock markets ended mixed. The Nikkei 225 underperformed the broader TOPIX Index. Punctuating the lackluster market performance was the deadly earthquake on January 1 that ravaged Japan’s Noto Peninsula in the Hokuriku region which was followed by a series of aftershocks. The devastating human cost rose to over 90 fatalities with hundreds unaccounted for. Additionally, major damage to infrastructure threatened to disrupt manufacturing and other supply chains. Multiple semiconductor-related factories were located in the area hardest hit by the earthquake; others anticipate that the disaster may cause delays in the restart of nuclear power plants across Japan. Initial estimates indicate, however, that the macroeconomic impact of the earthquake is likely to be limited. Debate arose about whether the calamity might impact monetary policy decision-making. The yen dropped sharply in reaction to the event, falling to the low JPY 145 to the U.S. dollar from around JPY 141 at the end of the previous week. The yield on the 10-year Japanese government bond remained unchanged at 0.61% over the shortened week.

Stocks in China declined last week over prevailing economic concerns. The Shanghai Composite Index dropped by 1.54% and the blue-chip CSI 300 plunged by 2.97%. The Hong Kong benchmark Hang Seng Index gave up 3% of its value. December’s economic data continued to reflect the same concerning picture about China’s uncertain economy. For a third consecutive month, the official manufacturing Purchasing Managers’ Index (PMI) was firmly in contraction territory, falling to 49.0 in December. The figure, which is below consensus estimates, was due to accelerated declines in new orders and exports. The nonmanufacturing PMI, by comparison, rose to 50.4 in December from 50.2 in November, due to stronger construction activity offsetting weakness in other areas of the services sector. Readings higher than 50 signify expansionary growth from the preceding month. More evidence of China’s property slump highlighted worries about a key growth sector, new home sales by the top 100 developers in the country. This indicator fell by 34.6% in December from the prior-year period, up from the 29.6% drop in November. Failing home prices, construction delays, and guilder defaults weigh on consumer sentiment as the housing downturn continues to drag on China’s economy.

The Week Ahead

Consumer and producer price index inflation data are among the important economic data scheduled for release in the coming week.

Key Topics to Watch

  • Consumer credit for November
  • Trade deficit for November
  • Wholesale inventories for November
  • New York Fed President John Williams speaks
  • Initial jobless claims for January 6
  • Consumer price index (CPI) for December
  • Core CPI for December
  • CPI (year-over-year)
  • Core CPI (year-over-year)
  • Budget statement for December
  • Producers price index (PPI) for December
  • Core PPI (year-over-year)

Markets Index Wrap-Up

error: Content is protected !!