Weekly Market Review – October 21, 2023

Stock Markets

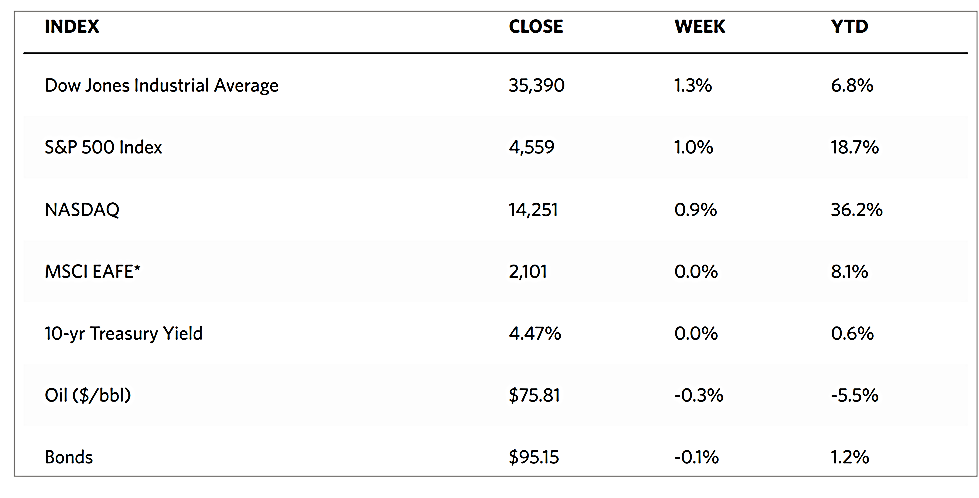
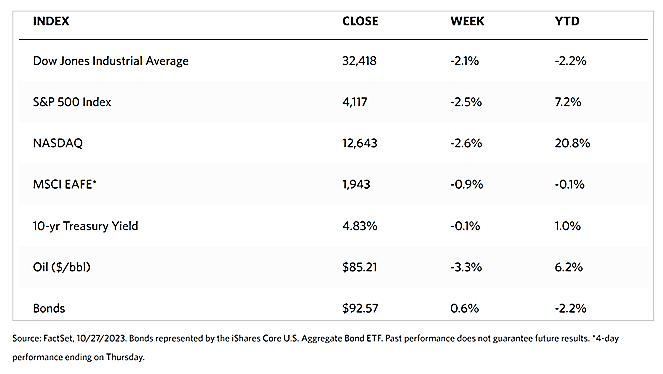
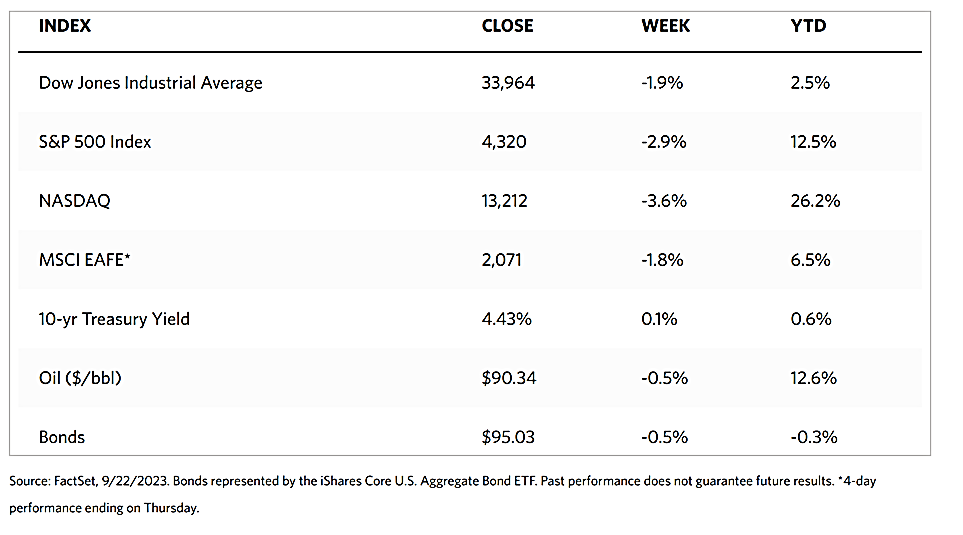
Equities lost some ground this week due to the continued rise of Treasury bond yields. The 10-year Treasury yield in particular is attracting investors’ attention as it approaches 5%, a rate last seen in 2007. All major indexes are down for the week. The Dow Jones Industrial Average (DJIA) corrected by 1.61% and the D.J. Total Stock Market Index fell by 2.41%. The broad-based S&P 500 Index similarly plunged by 2.39% while the technology tracker Nasdaq Stock Market Composite fell even deeper by 3.16%. The NYSE Composite Index dropped by 1.90%. The risk perception indicator CBOE Volatility (VIX) Index shot up by 12.37%, according to data from the Wall Street Journal Markets tracker.

Simultaneous with the rise in long-term bond yields, a host of macro and geopolitical concerns have pushed stock markets down and the Nasdaq almost into bear market territory, ending the week 19.91% below its intraday highs in early 2022. Investor sentiment weighed down on the S&P 500 Index which saw its biggest weekly decline in a month. The stock market began its week on a strong note, however, as it recorded the S&P 500 Index’s 15th straight Monday gain. The opening rally was helped by limited negative news coming from the Middle East turmoil over the weekend. The early gains were supplanted by deepening tensions as the week progressed. Share prices sharply fell on Thursday afternoon after news reports that a U.S. Navy destroyer shot down a cruise missile heading towards Israel and that a drone attack took place on a U.S. base in Iraq.

U.S. Economy

Officials of the Federal Reserve this week were markedly less dovish in their pronouncements about the direction inflation is expected to take. Richmond Fed Reserve President Thomas Barkin commented before real estate conference attendees in Washington that he still needs to see further confirmation of slowing demand and cooling inflation. While Fed Chair Jerome Powell admitted before the Economic Club of New York on Thursday that there appeared to be encouraging signs of a clear tightening in financial conditions, the Wall Street Journal nevertheless reported a sharp pullback in the markets after Powell admitted that there were no signs that the current stance of the Fed would result in a possible push into an economic recession.

Some economic data suggest that interest rates will remain higher for longer. The Commerce Department reported on Tuesday that retail sales rose 0.7% in October, amounting to almost double the consensus expectations. Online retailers, restaurants and bars accounted for most of the increase, suggesting that discretionary spending continued to remain strong. Sales rose 3.8% over the preceding 12 months which is roughly in line with consumer inflation. In any case, weekly jobless claims fell below 200,000 for the first time since January, thus surprising on the downside. Commerce data also indicated that the industrial side of the economy remained significantly weaker. Although overall industrial production remained roughly flat over the preceding year (up 0.8%), it rose by 0.3% in September. The impact of rising rates was further evident in the tight labor supply and the housing sector. September housing starts rose more than expected while building permits, a more forward-looking indicator, fell by 4.4%, its sharpest decline in 10 months.   

Metals and Mining

Gold’s move in the last two weeks is pleasantly surprising to those who decided to accumulate during the low phase. The yellow metal fell to a seven-month low on October 6, testing the $1.820 per ounce support briefly, and has bounced back with a fury without once looking back since. It rallied more than 9% in the last two weeks as prices pushed above $2,000 per ounce before the weekend. Silver is likewise remarkable, briefly dropping below $21 per ounce two weeks ago and now ending the week slightly short of $23.50, resulting in a 13% rally. Throughout the summer, bearish sentiment dogged the gold market as investors continued to react to the aggressive monetary policy stance of the Fed which will continue to restrict interest rates through the first semester of 2024. What ignited the new rally, however, appears to be the news of Hamas’s surprise attack that killed more than 1,000 Israelis. Gold is thus performing its role as a safe-haven asset during chaotic times

Precious metal spot prices were generally higher this week. Gold rose by 2.51% from its week-ago close of $1,932.82 to its closing price this week of $1,981.40 per troy ounce. Silver, which came from $22.72 the previous week, ended at $23.37 per troy ounce this week for a gain of 2.86%. Platinum closed this week at $899.61 per troy ounce for an increase of $1.75% over its previous week’s close of $884.13. Palladium ended lower by 4.28% this week to close at $1,150.56 per troy ounce from its previous week’s price of $1,101.28. The three-month LME prices of industrial metals generally closed lower for the week. Copper lost 0.01% from its previous week’s close at $7,949.00 to this week’s close at $7,948.50 per metric ton. Zinc closed lower by 0.33% from its previous week’s closing price of $2,446.00 to this week’s closing price of $2,438.00 per metric ton. Aluminum ended the week lower by 0.82% from last week’s close at $2,199.50 to this week’s close at $2,181.50 per metric ton. Tin lost 0.41% from last week’s close at $25,087.00 to this week’s close at $24,985.00 per metric ton.

Energy and Oil

The U.S. government was one of the key players who influenced oil prices this week. It announced the easing of Venezuelan sanctions as well as a possible replenishment of the U.S. Special Petroleum Reserve (SPR). The announcement of the easing of sanctions against Venezuela first sent oil prices downward, but the potential replenishment of the US SPR drove prices sharply upward. The U.S. Department of Energy announced that it would seek to purchase 6 million barrels of crude oil for delivery to the SPR in December to January and that it seeks to sign purchase contracts at $79 per barrel or less. Coupled with these announcements is the escalation of the Israel-Gaza crisis that further stoked fears that it may spread into a wider regional war. The geopolitical risk premium added further upside to prices. On Friday morning, WTI traded above the $90 per barrel level while ICE Brent neared the $94 per barrel mark.

Natural Gas

For the report week beginning Wednesday, October 11, and ending Wednesday, October 18, 2023, the Henry Hub spot price fell by $0.28 from $3.18 per million British thermal units (MMBtu) to $2.90/MMBtu. Making the Henry Hub price among the highest of all major U.S. hubs outside of California. The price of the November 2023 NYMEX contract decreased by $0.321, from $3.337/MMBtu at the start of the report week to $3.056 at the week’s end. The price of the 12-month strip averaging November 2023 through October 2024 futures contracts retreated by $0.154 to $3.375/MMBtu.

International natural gas futures prices advanced this report week. The weekly average front-month futures prices for liquefied natural gas (LNG) cargoes in East Asia increased by $2.32 to a weekly average of $16.50/MMBtu. Natural gas futures for delivery at the Title Transfer Facility (TTF) in the Netherlands, the most liquid natural gas market in Europe, increased by $2.49 to a weekly average of $15.78/MMBtu. In the week last year corresponding to this week (from October 12 to October 19, 2022), the prices were $32.11/MMBtu in East Asia and $37.30/MMBtu at the TTF.

World Markets

The European stock markets retracted amid uncertainty concerning the interest rate outlook and fears of a possible escalation of the Middle East conflict. The pan-European STOXX Europe 600 Index ended 3.44% lower for the week. A series of disappointing earnings reports exacerbated the worsening investor mood as all major Continental stock indexes also closed significantly downward. Germany’s DAX fell by 2.56%, France’s CAC 40 Index plunged by 2.67%, and Italy’s FTSE MIB plummeted by 3.12%. The UK’s FTSE 100 Index dropped by 2.60%. As investors weighed the prospects that interest rates would remain higher due to sticky inflation, European bond yields broadly climbed. The yield on the benchmark government bonds in the U.K. rose after inflation data was reported as unchanged instead of slowing further. Germany’s benchmark 10-year government bond yield rose and closed the week just short of 2.9%. Italian bond yields advanced, with the yield differential between German and Italian 10-year debt increasing to more than 200 basis points.

Japanese bourses fell over the week as the Nikkei 225 Index dropped by 3.3% and the broader TOPIX Index declined by 2.3%. The disappointing market performance occurred despite a slight easing of inflationary pressure in Japan, however, wage growth drew attention amid signs of a move higher in pay demands for next year. The news that the interest rates in the U.S. may remain higher for longer prompted a surge in bond yields. The yield on the 10-year Japanese government bond rose to its highest level in around 10 years at 0.83%, from 0.76% at the end of the previous week. The Bank of Japan (BoJ) announced an unscheduled bond-purchase operation during the week in an attempt to intervene to slow the pace of increases, The yen traded within the upper end of the JPY 149 against the U.S. dollar range, approaching the JPY 150 threshold that many speculate could prompt the Japanese authorities to intervene to arrest the currency’s slide. If the government fails to take action, such an excessive swing may cause harm to the real economy, causing regular people and businesses to suffer.

China’s stock prices also fell sharply mainly due to deepening property sector concerns that offset optimism of a better-than-expected gross domestic product report. The Shanghai Composite Index lost 3.4% of its value while the blue-chip CSI 300 plunged by 4.17%, obliterating the gains made from the reopening rally earlier this year. The Hong Kong benchmark Hang Seng Index declined by 3.6%. Despite receiving a 30-day grace period in August, China’s largest property developer, Country Garden, announced this week that it was unable to meet all of its offshore debt payments. The company’s missed dollar bond interest payment signifies that it will almost certainly default on a dollar bond for the first time, underscoring the troubles faced by China’s real estate market. Home price data, in the meantime, indicates no improvement in the ongoing property market slump. In 70 of China’s largest cities, new home prices fell by 0.3% in September from August. This is the third consecutive month of home price declines. Also announced during the week is a surprisingly strong GDP performance, with China’s economy expanding by an above-forecast 4.9% in the third quarter year-over-year, slowing from a 6.3% rise recorded in the second quarter.    

The Week Ahead

Important economic data scheduled to be released this week include PCE inflation data and third-quarter GDP.

Key Topics to Watch

  • S&P Case-Shiller home price index (20 cities) for August
  • S&P flash U.S. services PMI for October
  • S&P flash U.S. manufacturing PMI for October
  • New home sales for September
  • Gross Domestic Product for Q3
  • Initial jobless claims for Oct. 21
  • Durable goods orders for September
  • Durable goods minus transportation for September
  • Advanced U.S. trade balance in goods for September
  • Advanced retail inventories in September
  • Advanced wholesale inventories in September
  • Pending home sales
  • Personal income (nominal) for September
  • Personal spending (nominal) in September
  • PCE index for September
  • Core PCE index for September
  • PCE (year-over-year)
  • Core PCE (year-over-year)
  • Consumer sentiment (final)

Markets Index Wrap-Up

Weekly Market Review – October 14, 2023

Stock Markets

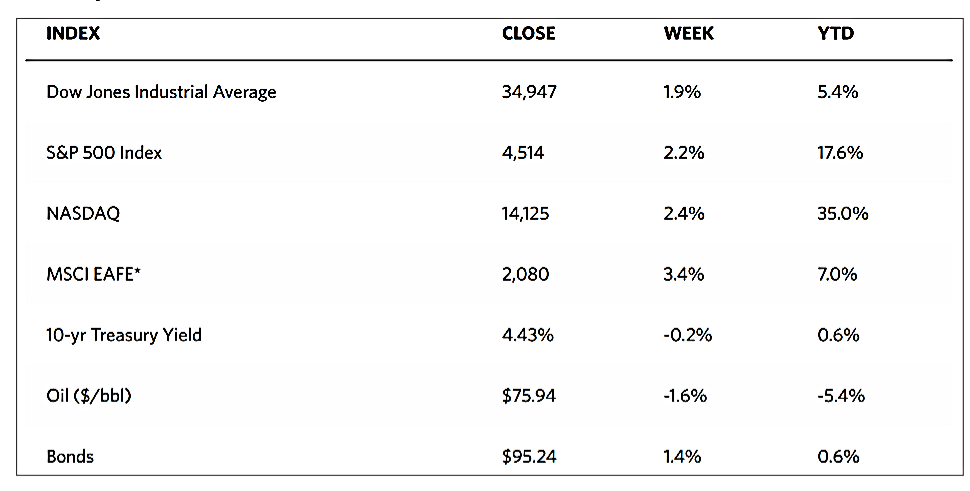
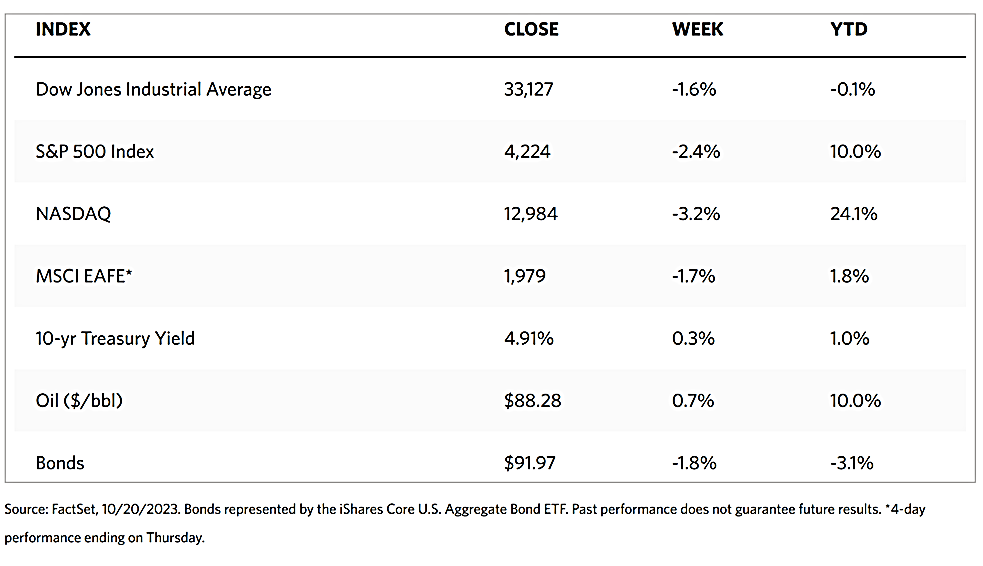
The major stock markets closed this week with mixed results, with investors tentatively assessing inflation data and dovish signals from Federal Reserve officials. According to the Wall Street Journal Markets report, markets ending with gains for the week were the Dow Jones Industrial Average (+0.79%), the DJ Total Stock Market Index (+0.24%), the S&P 500 Index (+0.45%) and the NYSE Composite Index (+0.72%). Ending lower for the week is the technology-heavy Nasdaq Stock Market Composite Index (-0.18%). The CBOE Volatility Index (VIX), which indicates investors’ risk perception, went up by 10.72% for the week. Large-cap value stocks performed well due to positive earnings news from Citigroup, Wells Fargo, and JP Morgan Chase. The banking giants realized healthy profits due to higher interest rates and their releases this week kicked off the start of the third-quarter earnings report season.

Energy shares and defense stocks received a boost from news about the likelihood of a broader Middle East war due to Hamas’ attack on Israel. Prospects of its escalation, however, weighed down airlines and cruise operators. News of Nordisk’s new dialysis drug, widely used to treat obesity, also demonstrated success in treating kidney disease caused Dialysis provider Da Vita to fall sharply. In a broader sense, however, the market seemed to gain optimism from an apparent shift in the official thinking of the Feds regarding inflation and the likelihood of a recession. The minutes of the Fed’s September meeting released midweek suggested that while rates will remain restrictive for some time, the communication has evolved from “how high to raise rates” to “how long to hold rates.” During the week’s end, federal fund futures were pricing in only a 5.7% probability of a rate hike when the Fed meets next in November, as against 27.1% likelihood during the week before.

U.S. Economy

The recent reading on the inflation rate has come below the Fed’s policy rate and will likely continue to moderate, providing further hope that the rates have peaked. Even the slightly higher-than-expected inflation reading did not cause investors to panic, given the volatility of the global geopolitical developments this week. The Labor Department reported on Wednesday that core (excluding food and energy) producer prices increased by 0.3% in September which is a tick above expectations. However, the 2.7% increase in year-over-year core producer prices surprised analysts as it was the highest level since May. This resulted from a significant upward revision in the previous month. The core consumer price index (CPI) inflation data that was released on Thursday, which rose by 4.1% for the year ended September 30, was in line with expectations and its slowest pace in two years.

Metals and Mining

This week, gold prices registered their strongest performance since early spring as it was driven by short covering and a strong safe-haven bid at the start and the end of the week. during a survey conducted this week, market analysts and retail investors have expressed an almost identical bullish consensus about gold’s prospects for the coming week, ending October 20. The massive price surge in the morning of Friday is evidence of when the market opens with full participation, possibly taking a long position in the yellow metal. In the coming week, there may be some slight pullback as some players take profits, but this precious metal will likely move back and forth as it consolidates before another possible breakout.

The spot prices for precious metals rose mostly for this week. Gold surged by 5.45% from its previous week’s close at $1,833.01 to this week’s close at $1,932.82 per troy ounce. Silver also climbed by 5.19% from its close last week at $21.60 to its close this week at $22.72 per troy ounce. Platinum gained by 0.29% from its closing price last week at $881.56 to this week’s closing price of $884.13 per troy ounce. Palladium bucked the trend, losing by 1.05% from its price last week of $1,162.78 to its price this week of $1,150.56 per troy ounce. The three-month LME prices of base metals were mostly down this week. Copper ended 1.21% lower from last week’s close at $8,046.00 to this week’s close at $7,949.00 per metric ton. Zinc lost 2.51% of its previous week’s price of $2,509.00 to this week’s closing price of $2,446.00 per metric ton. Aluminum gave up 1.79% of last week’s price of $2,239.50 to end this week with the price of $2,199.50 per metric ton. Tin defied the odds and gained 1.80% from last week’s closing price of $24,644.00 to end this week at the price of $25,087.00 per metric ton.

Energy and Oil

Sanctions imposed by the Biden administration this week had the unintentional effect of supporting oil prices. The U.S. government has slapped sanctions on two tanker owners (one based in Turkey and the other in the UAE) that allegedly transported Russian oil above the G7 price cap of $800 per barrel. ICE As the U.S. seeks to close loopholes in its sanctions mechanisms, Brent was set to finish the week at the unlikely price of $88 per barrel given the large U.S. inventory builds reported in the middle of the week. On the other hand, a promised increase in Russia’s oil price cap enforcement kicked off with two sanctioned tankers, and the rising market expectation that more sanctions will emerge on Iran in light of the Israel-Palestinian conflict have raised geopolitical risks and increased the possibility that the $90-per-barrel is once more within reach.

Natural Gas

For the report week beginning Wednesday, October 4, and ending Wednesday, October 11, 2023, the Henry Hub spot price rose by $0.27 from $2.91 per million British thermal units (MMBtu) to $3.18/MMBtu. The Henry Hub spot price rose above $3.00/MMBtu for the first time since January of this year. Regarding the Henry Hub futures price, the price of the November 2023 New York Mercantile Exchange (NYMEX) contract increased by $0.415, from $2.962/MMBtu at the start of the report week to $3.377/MMBtu at the end of the week. The price of the 12-month strip averaging November 2023 through October 2024 futures contracts climbed by $0,269 to $3.529/MMBtu. The NYMEX futures price at the Henry Hub has been steadily increasing since September 21 when the front-month contract settled at $2.61/MMBtu.

The international natural gas futures price changes were mixed for this report week. The weekly average front-month futures prices for liquefied natural gas (LNG) cargoes in East Asia decreased by $0.26 to a weekly average of $14.18/MMBtu. Natural gas futures for delivery at the Title Transfer Facility (TTF) in the Netherlands, the most liquid natural gas market in Europe, increased by $1.17 to a weekly average of $13.28/MMBtu. In the week last year corresponding to this report week (from October 5 to October 12, 2022), the prices were $34.81/MMBtu and $45.83/MMBtu in East Asia and at the TTF, respectively.

World Markets

Optimism from dovish comments from the Federal Reserve policymakers and reports that China was considering more economic stimulus measures drove European stocks up this week to end three consecutive weeks of losses. The pan-European STOXX Europe 600 Index closed 0.95% for the week in local currency terms. However, major stock indexes were mixed in the region. Italy’s FTSE MIB rallied by 1.53% higher. Germany’s DAX slid by 0.28%, while France’s CAC 40 Index fell by 0.80%. The UK’s FTSE 100 Index tacked on an additional 1.41%. European bond yields declined as investors flocked to safe-haven assets after the eruption of Hamas violence in the Middle East. Strong U.S. inflation data slowed the drop in yields. The benchmark 10-year German government bond yield closed near 2.75%. Furthermore, the minutes of the European Central Bank’s (ECB’s) September meeting showed that a solid majority of policymakers cast their votes in favor of raising the key deposit rate to 4.0%, a record high. The increase was intended to show the ECB’s determination to rein in inflation since headline and core inflation remained above 5%.

Japan’s stock markets rose over the week as they continued their strong year-to-date gains. The Nikkei 225 Index climbed by 4.3% while the broader TOPIX Index gained by 2.0%.  Historic weakness in the yen lent ongoing support, particularly for stocks whose companies are raking in higher dollar-denominated earnings. The yen weakened from about JPY 149.2 the week before to approximately JPY 149.6 against the U.S. dollar this week. The currency continued on its downward spiral despite attracting some support from investor demand for safe-haven currencies in light of the increased geopolitical uncertainties in the Middle East. Japanese authorities continued to emphasize that they would not hesitate to intervene if excess currency volatility develops, without ruling out any options. However, there has been no evidence of the government’s intervention in the markets to stem the yen’s drop. In other developments, the International Monetary Fund (IMF) revised its forecast for Japan’s economic growth in 2023 to 2.0% from 1.4% previously, as published this week in its October World Economic Outlook. A range of factors including pent-up demand, rebounding inbound tourism, accommodative monetary policy, and easing supply chain constraints boosting auto-expansion, are seen to support the country’s economic expansion.

In China’s first full week of trading after the Golden Week holiday, stocks declined as softer inflation and trade data renewed concerns that the economy may once more approach deflation. The Hong Kong benchmark Hang Seng climbed by 1.87%. Following August’s 0.1% rise, China’s year-on-year CPI remained unchanged in September mainly due to weaker food prices. Producer prices fell year-on-year by 2.5%, more than consensus estimates, although it eased from the 3.0% drop the previous month. Although trade and lending data remained weak, they nevertheless came in above expectations. Overseas exports fell by 6.2% in September from their year-ago figures, which was slower than the 8.8% August drop. Imports fell by 6.2% which was still better than the August contraction of 7.3%, marking the seventh consecutive monthly decline. The data shows that while some segments of China’s economy are stabilizing, it remains insufficient to dispel concerns about China’s weakening growth prospects.

The Week Ahead

This week, among the important economic data to be released are the retail sales, housing starts, industrial production, and capacity utilization reports.

Key Topics to Watch

  • Empire State manufacturing survey for October
  • Philadelphia Fed President Patrick Harker speaks (a.m.)
  • Philadelphia Fed President Patrick Harker speaks (p.m.)
  • U.S. retail sales for September
  • Retail sales minus autos for September
  • Industrial production for September
  • Capacity utilization for September
  • Fed Gov. Michelle Bowman speaks
  • Business inventories for August
  • Home builder confidence index for October
  • Richmond Fed President Tom Barkin speaks
  • Minneapolis Fed President Noel Kashkari speaks
  • Housing starts for September
  • Building permits for September
  • Fed Gov. Chris Weller speaks
  • New York Fed President John Williams speaks
  • Fed Beige Book
  • Fed Gov. Lisa Cook speaks
  • Initial jobless claims for Oct. 14
  • Philadelphia Fed manufacturing survey for October
  • Existing home sales for September
  • U.S. leading economic indicators
  • Fed Chairman Jerome Powell speaks
  • Chicago Fed President Austan Goolsbee speaks
  • Fed Vice-Chair for Banking Michael Barr speaks
  • Atlanta Fed President Raphael Bostic speaks
  • Dallas Fed President Lorie Logan speaks
  • Cleveland Fed President Loretta Mester speaks

Markets Index Wrap-Up

Weekly Market Review – October 7, 2023

Stock Markets

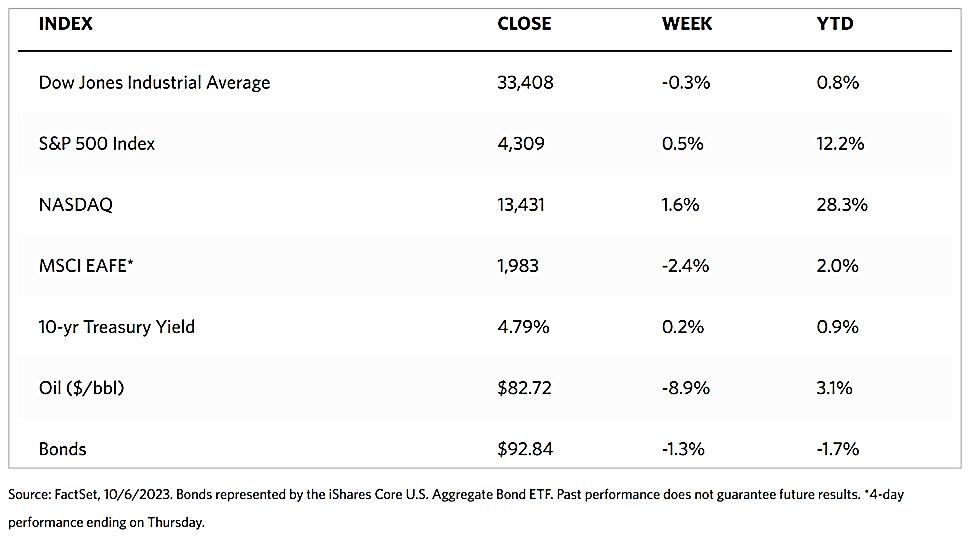
Another week of directionless trading ended in mixed major indexes. The Dow Jones Industrial Average (DJIA) closed down by 0.30% over the week while its Total Stock Market counterpart ended up by 0.19%.  The broad-based S&P 500 Index was slightly up by 0.48% while the midcap and small-cap stocks were down by 1.87% and 2.37%, respectively. The technology-heavy Nasdaq Stock Market Composite was up by 1.60%, while the NYSE Composite Index was down by 1.20%. The risk perception indicator, CBOE Volatility Index (VIX) ended the week lower by 0.40%.

During the week, the mega-cap information technology and internet stocks which constitute the bulk of the large-cap growth stocks outperformed the rest of the market. The Russel Index also showed how large caps outpaced the small-caps by the widest margin since March. Volumes were muted for most of the week as investors sought confirmation from economic indicators regarding the market’s direction. Investors were hoping that the official nonfarm payrolls report, due for release on Friday, would show another decline in hiring. This development was expected to convince the Federal Reserve to forego another rate hike in their monetary policy as such would be a welcome sign of cooling inflation. Before the equity market opened, however, stocks fell sharply on the news that more than double the expected new jobs created was reported by the Labor Department, suggesting that the economy was heating up and, therefore, inflation may be on the rise again.

U.S. Economy

The Labor Department reported an additional 336,000 nonfarm jobs added in September, a number double the consensus estimate and an acceleration from the previous three-month-average of 190,000. The closely watched official nonfarm payrolls report revealed that the average hourly earnings rose by 0.2% in the month, pulling the year-over-year gain down to 4.2%, the lowest level it has been since June 2021. The workforce participation rate likewise remained at the best level it has been since the beginning of the pandemic lockdowns in February 2020, at 62.8%.

The figures indicated a more nuanced bigger picture, that increasing supply was driving the labor market rather than a rampant demand for workers, thus reflecting a more benign inflationary environment. The unemployment rate held steady at 3.8%, accompanied by a growing number of workers joining the workforce. The ongoing health of the labor market is viewed as categorically positive for consumers and GDP growth. Unfortunately, the market is seeing it through the lens of the upcoming Fed monetary policy as a reason for the policymaking body to hike rates. This caused yields to move up and stocks to pull back.

Metals and Mining

After seeing nine consecutive months of losses, the gold market did not start the fourth quarter with a good performance, continuing the precious metal’s longest daily losing streak in seven years. The yellow metal still ended this week with an almost 1% loss, although its closing price was still off its seven-month lows. As it looks to hold critical near-term support levels, there is still hope for gold, even though it will continue to be sensitive to rising bond yields. The U.S. bond market saw a significant selloff in long bonds while gold was treading its March lows, thus driving yields higher. The 30-year yield rose to 5% this week for the first time since 2007. Simultaneously, the yield on 10-year notes rose to a new 16-year high at 4.8%.

The spot prices for precious metals closed lower for the week. Gold closed at $1,833.01 per troy ounce this week, down by 0.84% from last week’s close at $1,848.63. Silver closed at $21.60 per troy ounce this week, down by 2.61% from the previous week’s close at $22.18. Platinum ended the week at $881.56 per troy ounce, down by 2.90% from last week’s close at $907.90. Palladium closed this week at $1,162.78 per troy ounce, 6.84% down from last week’s close at $1,248.19.  The three-month LME prices of industrial metals were generally down for the week. Copper, which ended the previous week at $8,270.50, closed this week at $8,046.00 per metric ton, down by 2.71%. Zinc, which closed one week ago at $2,649.50, ended this week at $2,509.00 per metric ton, down by 5.30%. Aluminum, which ended last week at $2,347.00, closed this week at $2,239.50 per metric ton, down by 4.58%. Bucking the trend is Tin, which rose by 2.92% from its previous close at $23,944.00 to its close this week at $24,644.00 per metric ton.

Energy and Oil

The week just ended was the worst week for crude since March. Pressured by the U.S. bond selloff that cast a shadow over the economic outlook for 2024, oil prices have receded by $10 per barrel. This week’s EIA numbers indicated a steep drop in gasoline demand across the U.S., thus dealing another blow to crude prices. On the supply side, Saudi Arabia announced that it is maintaining its 1 million barrel per day production cut until the end of the year 2023 and signaled it would review its decision again next month and deepen the cut if required. With focus directed at the U.S. non-farm payroll data released on Friday, the chances of ICE Brent, currently hovering at $84 per barrel, climbing to triple digits is firmly out of the question for now.

Natural Gas

For the report week beginning Wednesday, September 27, and ending Wednesday, October 4, 2023, the Henry Hub spot price rose by $0.20 from $2.71 per million British thermal units (MMBtu) to $2.91/MMBtu. The October 2023 NYMEX contract expired on October 4 at $2.764/MMBtu. The November 2023 NYMEX contract price increased to $2.962/MMBtu, up by $0.06 from the start to the end of the report week. The price of the 12-month strip averaging November 2023 through October 2024 futures contracts rose by $0.04 to $3.260/MMBtu.

International natural gas futures prices were mixed for this report week. The weekly average front-month futures prices for liquefied natural gas (LNG) cargoes in East Asia increased by $0.20 to a weekly average of $14.44/MMBtu. Natural gas futures for delivery at the Title Transfer Facility (TTF) in the Netherlands, the most liquid natural gas market in Europe, decreased by $0.50 to a weekly average of $12.11/MMBtu. In the week last year corresponding to this week (the week beginning September 28 and ending October 5, 2022), the prices were $37.99/MMBtu and $51.00/MMBtu in East Asia and at the TTF, respectively. Stocks of natural gas in storage in the European Union reached 96.3% of capacity on Tuesday, compared with 89.7% on the same day last year.

World Markets

In reaction to the surge in bond yields amid worries about an extended period of higher interest rates, the pan-European STOXX Europe 600 Index ended lower by 1.18% in local currency terms. The major stock indexes likewise lost ground. Germany’s DAX fell by 1.02%, France’s CAC 40 Index dipped by 1.05%, and Italy’s FTSE MIB plunged by 1.53%. The UK’s FTSE 100 Index fell by 1.49%. At the end of a volatile week in the European bond markets, the yield on Germany’s 10-year government bond fell below 3% but remained near its highest in more than a decade. Amid cautious sentiment, French and Italian bond yields ticked up. In the UK, the yield on the benchmark 10-year UK government bond stayed close to its highest levels going all the way back to August 2008 on signs of sticky inflationary pressures.

In Japan, stocks fell over the week. The Nikkei 225 Index came down by 2.7% while the broader TOPIX Index slid by 2.6%. Amid surging U.S. bond yields and concerns that central banks will remain defensive for a longer period, Japanese equities came under pressure. The country’s economic data signaled that real wages and consumer spending continued to plummet in August, thus further weighing on investor sentiment. On the contrary, business sentiment among Japanese companies was boosted by a weak yen, as shown by the Bank of Japan’s (BoJ’s) latest quarterly Tankan survey, thus lending some support to equities. There was widespread speculation that Japan’s Ministry of Finance (MoF) intervened in the foreign exchange market to arrest the freefall of the yen, following the currency’s almost instantaneous surge after it breached the JPY 150 level versus the U.S. dollar. Many participants anticipated that this breach could serve as a trigger for monetary authorities to take action. After the yen fell to its lowest level in 11 months, the MoF officials neither confirmed nor denied whether they intervened. However, they continued to stress that they would act to control excess volatility without ruling out any options. The yen closed the week stronger at around JPY 149 against the greenback.

China’s financial markets were closed this week in celebration of the Mid-Autumn Festival and National Day holiday. They are scheduled to reopen on Monday, October 9. The Hong Kong benchmark Hang Seng Index declined by 0.14% for the holiday-shortened weekend. On the economic front, China’s factor activity entered into expansion territory for the first time since March, the most recent indication that the economy may have at last bottomed out. The official manufacturing PMI rose to 50.2 in September, an optimistic outcome since above 50 signals expansion, and the reading was better than expected as well as higher than the 49.7 reading for August. The nonmanufacturing PMI was also higher than consensus, at 51.7 in September from 51.0 in August. A separate indicator, the private Caixin/S&P Global survey of manufacturing and services activity both came down slightly from the previous month although they remain in expansion. During the eight-day holiday, domestic activity in China picked up significantly. During the first four days of the holiday, about 395 million trips were taken by road, rail, air, and waterways which reckoned as 76% higher than the same period the previous year. Box office sales reached RMB 1.2 billion in the first three days, also higher than corresponding sales last year. The offshore gambling hub of Macau recorded more than 160,000 visitors from mainland China and Hong Kong on Saturday, the highest single-day total since the pandemic.

The Week Ahead

Among the important economic news scheduled for release this week are the minutes of the Federal Reserve’s September FOMC meeting, the consumer price index (CPI), and producer price index (PPI) inflation data.

Key Topics to Watch

  • Dallas Fed President Logan speaks
  • Fed Gov. Jefferson speaks
  • KFIB optimism index for September
  • Wholesale inventories for August
  • Producer price index for September
  • Core PPI for September
  • PPI year over year
  • Core PPI year over year
  • Minutes of Fed’s September FOMC meeting
  • Initial jobless claims for October 7, 2023
  • Consumer price index for September
  • Core CPI for September
  • CPI year over year
  • Core CPI year over year
  • Import price index for September
  • Import price index minus fuel for September
  • Consumer sentiment (preliminary) for October

Markets Index Wrap-Up
Weekly Market Review – September 30, 2023

Stock Markets

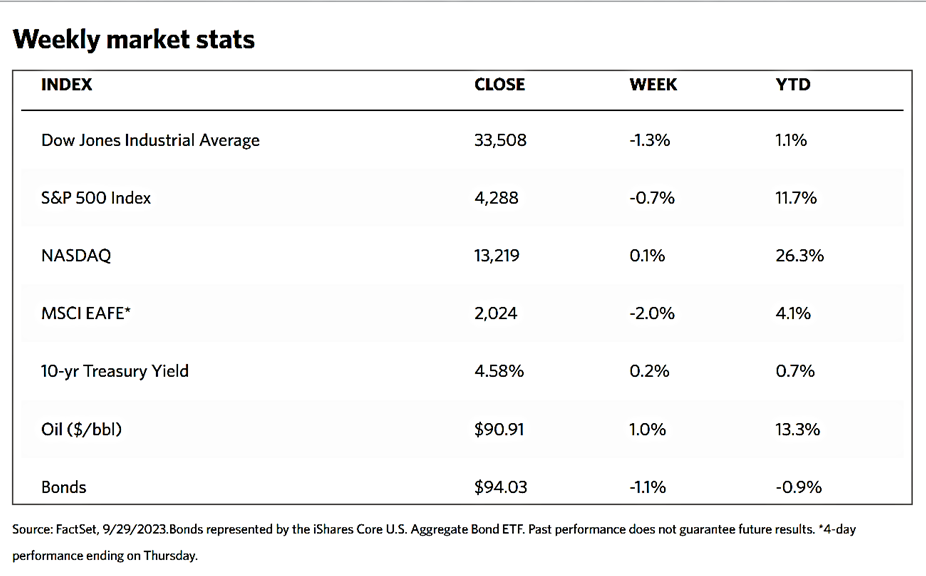
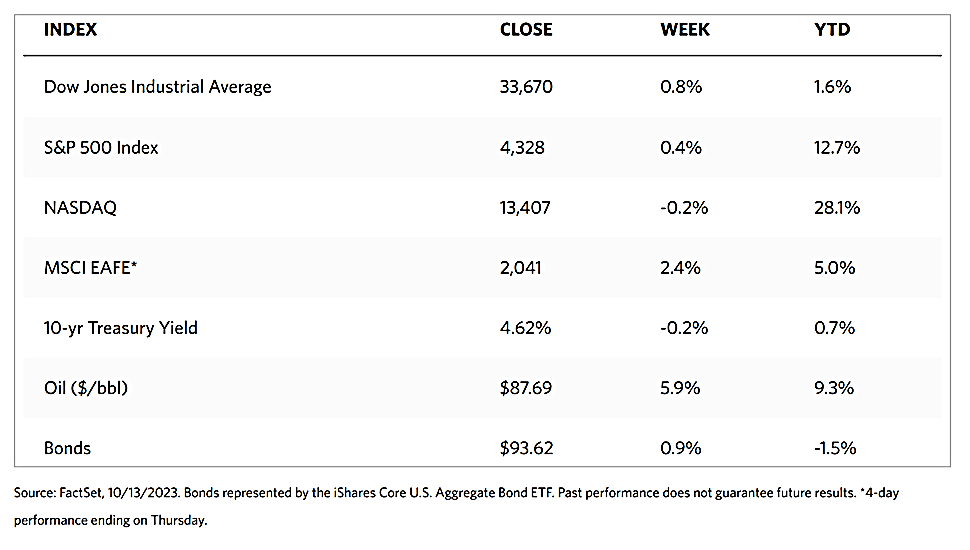
Several geopolitical issues weighed on investor sentiment this week, including higher oil prices pushing inflation worries and the looming U.S. government shutdown in the absence of a bill raising the debt ceiling by September 30. The S&P 500 Index suffered a fourth consecutive weekly decline, closing lower this week by 0.74%. The Dow Jones Industrial Average (DJIA) also fell for the week, by 1.34%, while the D.J. Total Stock Market Index slid by 0.54%. The NYSE Composite was also down by 1.10%. The S&P midcaps and small caps gained some ground, rising by 0.26% and 0.42% respectively, even as the Nasdaq Stock Market Composite Index inched upward by a slim 0.06%. The sector that lost the most ground within the index was utilities, although bucking the trend were energy stocks which outperformed the rest.

Fear that inflation will prove more difficult for central banks to rein in spurred a sell-off in bonds. On Wednesday, the yield on the benchmark 10-year U.S. Treasury note peaked above 4.6%, sending bond prices on a downward spiral (since bond prices and yields move opposite to each other). On the other hand, 10-year Treasury yields inched modestly lower after the release of encouraging eurozone and U.S. inflation data. Also coming under strong selling pressure were tax-exempt municipal bonds and high-yield bonds.

U.S. Economy

The core personal consumption expenditure (PCE) index for August increased 3.9% year-on-year. This is a key inflation indicator that is closely watched by the Federal Reserve as it excludes the volatile food and energy categories. Presently, it is at the lowest annual inflation rate in around two years but still above the central bank’s 2% target rate. The latest reading is a moderation from the upwardly revised 4.3% annual inflation rate recorded in July. The core PCE inflation came in below expectations at 0.1% month-over-month. With all items included, the monthly inflation was driven by high energy prices to rise to 0.4% from 0.2% in July.

Durable goods orders and shipments surprised on the upside, increasing month-over-month in August, despite the weakness in new orders signaled by recent manufacturing surveys. Paced by strength in machinery, headline orders increased by 0.2% whereas consensus expectations had called for a decline. Durable goods orders, excluding transportation, increased by 0.4% from July. This measure is considered to reflect the near-term indicator of the economy’s health. It excludes the transportation category because the big price tags on aircraft and other equipment can distort underlying trends by creating the potential for large orders.

On another front, the Conference Board’s gauge of U.S. consumer confidence slid to 103.0 in September. This outcome is below expectations and is lower than the preceding month’s upwardly revised reading of 108.7. The survey’s expectations component accounts for much of the weakness in this indicator. The component declined by 9.6 points to 73.7, as the percentage of respondents who thought a recession was “somewhat” or “very likely” ticked up after declining in August.   

Metals and Mining

The gold market had a significant sell-off this week which dropped the spot price of gold by 4% from Friday the week before. This was the worst week for gold since June 2021. While this looks bad, there is still room for the yellow metal to descend further. Some analysts mentioned that they would not be surprised to see gold prices test once more prices close to the $1,800 per ounce level. Since mid-June, the market has been consolidating between the tight band from $1,900 to $1,980; since the consolidation was relatively lengthy, the breakdown will tend to be violent. Furthermore, the surging momentum in the bond yields and the U.S. dollar pointed to the eventual breakdown in precious metals.

The spot prices of precious metals have exhibited weakness this week. Gold plummeted by 3.98% this week, from its closing price one week ago at $1,925.24 to its closing price this week at $1,848.63 per troy ounce. Silver rose slightly by 0.27% from its closing price last week at $22.12 to its closing price this week at $22.18 per troy ounce. Platinum ended the week lower by 2.45%, from its previous price of $930.73 to its price this week at $907.90 per troy ounce. Palladium closed this week slightly lower by 0.48%, from last week’s closing price of $1,254.23 to this week’s closing price of $1,248.19 per troy ounce. The three-month LME prices of base metals ended mixed. Copper ended this week at $8,270.50 per metric ton, up by 0.93% from the previous price of $8,194.00. Zinc also ended up closing at $2,649.50 per metric ton, gaining by 5.39% from its week-go closing at $2,514.00. Aluminum closed this week at $2,347.00 per metric ton, rising by 6.10% from last week’s close at $2,212.00. Tin ended this week at $23,944.00 per metric ton, falling by 6.52%            from last week’s price of $25,613.00.

Energy and Oil

Despite some very bullish news this week, ranging from improving macroeconomic outlook in China to wafer-thin Cushing stocks, oil prices have been trading within a tight range as crude remains overbought and potential surges above $95 per barrel meet with stiff resistance. Crude inventories at the key U.S. storage hub of Cushing, Oklahoma fell to their lowest since July 2022, at 22.0 million barrels. At this level, operators fear operational risks as oil becomes difficult to remove if tank storage holds less than 20 million barrels. Meanwhile, the expiry of November ICE Brent futures has seen backwardation between the expiring month and the December contract shoot up to an astounding $2 per barrel. In the week to come, focus will once more pivot towards Saudi Arabia as OPEC+ meets next week and the market anticipates the announcement of another round of potential production cuts.

Natural Gas

For the report week from Wednesday, September 20 to Wednesday, September 27, 2023, the Henry Hub spot price fell by $0.06 from $2.77 per million British thermal units (MMBtu) to $2.71/MMBtu. The October 2023 NYMEX contract expired by the end of the report week at $2.764/MMBtu, up by $0.03 from the start of the report week. The price of the November 2023 NYMEX contract, which represents the first month of sales of natural gas for winter heating season delivery, decreased to $2.899/MMBtu, down by $0.02 from the start to the end of the report week. The price of the 12-month strip averaging November 2023 through October 2024 futures contracts declined by $0.01 to $3.220/MMBtu.

International natural gas futures prices increased this report week. The weekly average front-month futures prices for liquefied natural gas (LNG) cargoes in East Asia increased by $0.80 to a weekly average of $14.63/MMBtu. Natural gas futures for delivery at the Title Transfer Facility (TTF) in the Netherlands, the most liquid natural gas market in Europe, increased by $1.32 to a weekly average of $12.61/MMBtu, the highest weekly average since late April. In the week last year corresponding to this report week (the week beginning September 21 and ending September 28, 2022), the prices were $39.77/MMBtu in East Asia and $53.45/MMBtu at the TTF.   

World Markets

Stocks fell across Europe over the just-concluded week amid concerns about a prolonged period of higher interest rates and a weak Chinese economy. The pan-European STOXX Europe 600 Index ended 0.67% lower in local currency terms. Major stock markets followed the same trend. Italy’s FTSE MIB fell by 1.16%, Germany’s DAX descended by 1.10%, and France’s CAC 40 declined by 0.69%. The UK’s FTSE 100 Index slid by 0.99%. Bond investors focused on the higher-for-longer rates narrative in financial markets, sending European government bond yields broadly up. Germany’s benchmark 10-year government bond yield rose to almost 3%, a level it had not seen in more than ten years, before backing off its peak on Friday. In Italy, amid concerns that the government would need to increase debt issuance next year to finance a bigger deficit, bond yield also advanced. The yield on the UK benchmark 10-year bond climbed above 4.5% before falling back slightly on Friday. In the meantime, Eurozone inflation dropped to 4.3%, its lowest level in two years and weaker than forecasted. This was a marked improvement from August’s 5.2%. The core rate’s initial estimate (excluding food, energy, alcohol, and tobacco) likewise declined from 5.3% to 4.5%.

Japan’s stock market pulled back for the week. The Nikkei declined by 1.7% while the broader TOPIX Index descended by 2.2%. The market reacted to concerns that the U.S. interest rates may potentially remain higher for a longer period, simultaneous with a surge in the price of oil. However, investors welcomed the announcement by the Japanese government that a new economic stimulus plan is about to be launched. Meantime, the Bank of Japan remained staunchly committed to its ultra-accommodative monetary policy stance to keep its inflation target in check, to which the slowing core inflation in the Tokyo area lent support. Regarding the national currency, the yen traded mostly within the JPY 148 range against the U.S. dollar, although it briefly weakened beyond the JPY 149 level and touched an 11-month low before recovering. The move fueled further speculation that the Japanese monetary authorities could intervene in the foreign exchange market to prop up the yen under its repeated declaration that they would respond appropriately to sudden currency fluctuations. The yield on the 10-year Japanese government bond (JGB) rose to 0.76% this week from 0.74% at the end of the previous week.

Chinese stocks declined over the holiday-shortened trading week, during which investor sentiment was dampened by a lack of uplifting economic news. The blue-chip CSI 300 Index and Shanghai Composite Index both lost ground during the week that ended Thursday. Stock Markets in mainland China were closed on Friday which was the start of the 10-day holiday for the Mid-Autumn Festival and National Day. The markets will reopen on Monday, October 9. The Hong Kong benchmark Hang Seng Index fell by 1.37% for the week ended Friday. There were no official economic news released in China during the week. However, a private survey showed that prices in China are recovering, allaying fears of a prolonged deflation. The World Economics survey reported that its all-sector price index for China ascended to a 14-month high in September. The survey was the latest data point indicating that China’s economy may have bottomed out after losing momentum following a post-lockdown recovery in this year’s first quarter. Signs of stabilization in the Chinese economy also appeared to be indicated by official data for August released earlier in September. Retail sales and the industrial economy grew faster than expected year-on-year while unemployment fell unexpectedly from July. On the other hand, fixed-asset investment growth failed to meet expectations due to a steeper decline in property investment.

The Week Ahead

Included in the important economic data for release this week are the unemployment rate for September and other labor market readings including the JOLTS Job Openings report.

Key Topics to Watch

  • S&P final U.S. manufacturing PMI
  • ISM manufacturing
  • Construction spending
  • Job openings
  • ADP employment
  • S&P final U.S. services PMI
  • Factory orders
  • ISM services
  • Initial jobless claims
  • U.S. trade deficit
  • U.S. employment report
  • U.S. employment rate
  • U,S. hourly wages
  • Hourly wages year-over-year
  • Consumer credit

Markets Index Wrap Up

Weekly Market Review – September 23, 2023

Stock Markets

Investors’ reaction to rising U.S. Treasury yields and hawkish forecasts from the Federal Reserve’s latest meeting weighed on the major U.S. stock market benchmarks in the trading week just concluded. The Dow Jones Industrial Average (DJIA) descended by 1.89% while the D.J. Total Stock Market recorded a 3.03% loss. The broad-based S&P 500 Index came down by 2.93% while the technology-tracking Nasdaq Stock Market Composite fell by 3.62%. The NYSE Composite Index slid by 2.53%. The investor risk perception indicator CBOE Volatility Index (VIX) shot up by 24.73%. On Thursday, the S&P 500 Index suffered its worst single-day loss in six months. This week was its third consecutive week of losses.

Additionally, investors are concerned about the repercussions of the United Auto Workers’ strike that began with three plants on September 15 and has now expanded to include 20 states nationwide. There is also the potential that the U.S. government will shut down for failure to pass the 12 annual appropriation bills that fund government operations before the current fiscal year ends on September 30. The market sell-down may also have been worsened by tax-loss harvesting before the fiscal year-end. The Fed maintained its short-term lending benchmark rate at a target level set during the previous meeting in July of 5.25% to 5.50%. The market was surprised, however, when policymakers declared an outlook for rates in 2024 that was significantly higher than expected, with a correspondingly higher rate prediction for 2025. The Fed raised its growth forecast which is an admission that the economy has been more resilient than expected.

U.S. Economy

The next move by the Federal Reserve regarding future rate cuts will depend upon the trajectory of the economy. It forecasts stronger growth in 2023 to 2024 which led to the likelihood of raising interest rates once more to intercept a further increase in inflation due to the heating economy. But if growth is maintained while inflation eases up, then the Fed may gradually normalize rates by gradually reversing it to a neutral level. The biggest surprise out of this week’s meeting is that the Fed sees only two potential rate increases next year, down from the initial four rate cuts it projected in June.

Early signs are evident of easing in consumption and the labor market, but the Fed’s forecast of 2024 growth indicates only moderate cooling, to 1.5% annual growth, before returning to 1.8% in 2025. It places the unemployment rate at a constant 3.8% for the current year, and growing to no higher than 4.1% for the cycle, well below the 10-year average of 5.0% unemployment. The initial reaction in the market has been a greater than proportional move higher in Treasury yields and a rapid descent in stocks. Both the 2-year and the 10-year U.S. Treasury yields hit highs of this cycle after the Fed meeting. The laggards in recent days have been the longer-duration parts of both fixed-income and equity markets. Since a rapid rise in yields has weighed particularly on higher valuation growth parts of the market historically, this trend may continue in the short term.

Metals and Mining

While the gold market may not just yet have the momentum to break out of its neutral trading channel around $1,950, it nevertheless remains well-positioned to benefit if and when sentiment turns, a possibility that may materialize sooner than expected. The U.S. has so far been able to avoid a recession and expectations of a soft landing are gradually firming up, but many analysts continue to doubt whether this optimistic goal can be realistically achieved. Gold’s price action is proving that investors are more cautious about protecting themselves against a downturn. Gold’s resilience is more remarkable considering how, in the past week, the Federal Reserve decided against raising interest rates during its meeting but maintained its hawkish stance.

The spot price of precious metals moved sideways for the week. Gold went up by only 0.07% from the previous week’s close at $1,923.91 to close at $1,925.24 per troy ounce this week. Silver went down significantly by 3.99% from the earlier week’s closing price of $23.04 to the recent closing price of $22.12 per troy ounce. Platinum, which was formerly at $29.69, ended this week at $930.73 per troy ounce, for an increase of 0.11%. Palladium gained 0.27% from last week’s closing price of $1,250.89 to close this week at the price of $1,254.23 per troy ounce. The three-month LME prices of industrial metals are generally down. Copper receded by 2.66% from last week’s closing price of $8,417.50 to end this week at the price of $8,194.00 per metric ton. Zinc declined by 2.18% from its previous price of $2,570.00 to end this week at $2,514.00 per metric ton. Aluminum inched down by 0.56% from its closing price last week of $2,224.50 to its close this week at $2,212.00 per metric ton. Tin ended this week 1.09% lower from its previous week’s close at $25,895.00 to close at $25,613.00 per metric ton.

Energy and Oil

Diesel price were once again boosted by Russia’s decision to ban fuel exports for an undetermined period. Moscow has temporarily banned exports of gasoline and diesel to all countries except for Belarus, Kazakhstan, Armenia, and Kyrgyzstan, to stabilize runaway fuel prices that have been hitting record highs almost every day in September. As a consequence, Europe is experiencing a stunning $45 per metric ton day-to-day surge on its middle distillates. The rise in distillates likewise pushed oil prices higher, offsetting the downward pressure caused by economic developments. Europe is almost certain to head into contraction in the third quarter of this year, while the U.S. Fed reiterated its “higher for longer” interest rate policy, Oil prices were kept largely unchanged by the worsening macroeconomic outlook compared to a week ago, with ICE Brent still hovering around the $94 per barrel price level.

Natural Gas

For the report week beginning on Wednesday, September 13, and ending on Wednesday, September 20, the Henry Hub spot price increased by $0.01 from $2.76 per million British thermal units (MMBtu) to $2.77/MMBtu. Regarding the Henry Hub futures market, the price of the October 2023 NYMEX contract increased by $0.053, from $2.680/MMBtu at the start of the week to $2.733/MMBtu at the end of the week. the price of the 12-month strip averaging October 2023 through September 2024 futures contracts declined by $0.06 to $3.180/MMBtu.

International natural gas futures prices ascended this report week. The weekly average front-month futures prices for liquefied natural gas (LNG) cargoes in East Asia rose by $0.47 to a weekly average of $13.83/MMBtu. Natural gas futures for delivery at the Title Transfer Facility (TTF) in the Netherlands, the most liquid natural gas market in Europe, increased by $0.31 to a weekly average of $11.29/MMBtu. In the week last year corresponding to this report week (from September 14 to September 21, 2022), the prices were $43.97/MMBtu in East Asia and $56.63/MMBtu at the TTF.

World Markets

European stocks followed the cue in the U.S. markets. The pan-European STOXX Europe 600 Index ended lower by 1.98% as the region’s central banks signaled that interest rates will remain elevated for some time into the future. The economic outlook was further clouded by higher oil prices and poor business activity data. Major country stock indexes likewise went south. Italy’s FTSE MIB dipped by 1.13%, Germany’s DAX declined by 2.26%, and France’s CAC 40 slumped by 2.67%. The UK’s FTSE 100 Index hardly changed either way in local currency terms as investor perception of equities earning in dollars was propped up by a depreciation of the UK pound’s exchange rate to the U.S. dollar. Since many UK-listed firms are multinationals with overseas revenues, a weaker British pound sterling provides support to the index. After European Central Bank (ECB) officials announced that they could not rule out another interest rate increase, and after the Fed indicated they would maintain their rates higher for longer, Eurozone government bond yields increased.

Japan’s stock markets also fell for the week. The Nikkei Index ended lower by 3.4% week-on-week and the broader TOPIX declined 2.2% for the same period. The signals sent by the US. Federal Reserve regarding keeping its interest rates higher for longer to bring inflation under control impacted heavily on investor sentiment in Japan. Japan, on the other hand, continued to maintain its ultra-loose monetary policy as expected by market players. This, in turn, dashed hopes that the central bank would hint at an exit from negative interest rates. The continued monetary policy divergence between the Fed’s hawkish stance and the dovish Bank of Japan (BoJ) pushed the yen lower against the U.S. dollar, from around JPY 147.8 the previous week to about JPY 148.3 per greenback this week. Finance officials signified that it would not rule out any options to respond to excessive currency volatility on the occasion that speculators take advantage of the situation regarding concerns about potential intervention in the foreign exchange markets to prop up the yen.

Chinese stocks climbed as investors grew increasingly optimistic about the brighter economic future of the country. The blue-chip CSI 300 Index gained by 0.81% while the Shanghai Composite Index added 0.47%. Hong Kong’s benchmark Hang Seng Index lost by 0.7%. The official data for August which was released the prior week provided some evidence of economic stabilization, although no major economic indicators were released in China this week, Retail sales, industrial production, and lending activity increased more than forecasted last month compared to one year ago. However, fixed-asset investment grew less than expected as the drop in property investment worsened. On Thursday, the State Council, which is China’s cabinet, promised to accelerate measures to consolidate China’s recovery and continue supporting growth in 2024, according to state media. Senior officials acknowledged that China is facing economic challenges, but are optimistic that historical trends point to the country’s economic improvement over the long-term. In the meantime, Chinese banks kept their one- and five-year loan prime rates unchanged after the People’s Bank of China (PBOC) kept its medium-term lending facility rate on hold the week before simultaneous with reducing the reserve requirement ratio for the second time this year. PBOC officials feel there is sufficient policy room to support China’s recovery, signaling that there may be further easing following this month’s pause.

The Week Ahead

Included among the important economic data scheduled for release in the coming week are a read on consumer confidence, new home sales, and PCE inflation data for August.

Key Topics to Watch

  • New home sales
  • S&P Case Shiller home price index (20 cities)
  • Consumer confidence
  • Fed Gov. Bowman speaks
  • Durable goods orders
  • Durable goods minus transportation
  • Initial jobless claims
  • GDP (revision)
  • Fed Gov. Cook speaks
  • Fed Chairman Powell speaks
  • Personal income
  • Personal spending
  • PCE Index
  • Core PCE Index
  • PCE (year-over-year)
  • Core PCE (year-over-year)
  • Advanced U.S. trade balance in goods
  • Advanced retail inventories
  • Advanced wholesale inventories
  • Chicago Business Barometer
  • Consumer sentiment (final)

Markets Index Wrap Up

Weekly Market Review – September 16, 2023

Stock Markets

Stock indexes ended up mixed this week as investors waited on the sidelines for confirmation of a clearer trend. The Dow Jones Industrial Average (DJIA) ended slightly up by 0.12% although the DJ Total Stock Market lost 0.21%. The broad-based S&P 500 Index inched down by 0.16% and the technology-tracking Nasdaq Stock Market Composite dipped even lower, losing 0.39% of its value. The NYSE Composite, like the DJIA, added 0.60% at the week’s close. The CBOE Volatility Index, the market’s risk perception indicator, descended by 0.36%. Value stocks led the gains while large-cap shares outperformed small caps. The investors’ rush to value is a reaction to the U.S. benchmark West Texas Intermediate oil prices surging above $90 per barrel for the first time since November 2022.

Meanwhile, Apple’s new product introduction event on Tuesday included a price increase on its top-of-the-line iPhone 15, causing technology and growth stocks to pull back. Sentiment towards the technology sector was further dampened through the week after Apple’s products received mixed reviews. The broad market was boosted, however, by the initial public offering of 2023 triggering a first-day price jump as shares of a UK microchip designer started trading on the Nasdaq on Tuesday. Positive economic data released on Wednesday further sent optimistic waves across the markets.

U.S. Economy

On Wednesday, the eagerly anticipated August consumer price index (CPI) data was released. It showed that the Federal Reserve has achieved some progress in its attempt to control inflation. Unfortunately, the recent resumption of increases in energy prices may result in further tightening monetary policy by the central bank. The widely expected effect of higher gasoline prices materialized as headline CPI number showed the largest monthly increase since August 2022. Nevertheless, the markets took in stride the news that the core CPI increase, which excluded food and energy, was marginally higher than expected. On Thursday, the August producer price index (PPI) data similarly indicated that the headline producer prices rose more than expected while the core PPI fell in line with expectations.

In the meantime, the retail sales for August were strong which further demonstrated that consumers remain willing to spend.  Overall, the week’s economic data hardly impacted the market’s expectations that the Fed will hold rates steady at its policy meeting scheduled for September 19-20. Much of the economic data seems to affirm the growing expectation for a soft-landing scenario that inflation will gradually cool and the Fed’s target rate will be achieved without a deep recession. Affirming this outlook, Wall Street’s widely-followed “fear gauge,” the Chicago Board Options Exchange (CBOE) Volatility Index, or VIX, descended to its lowest level since before the onset of the pandemic in early 2020. U.S. Treasury yields, on the other hand, experienced a modest increase over most maturities as prices were little changed in the secondary markets, with investor attention being focused on the primary market.

Metals and Mining

The gold market appears to have broken out of the $1,800 support only to be stuck in directionless range trading between $1,900 and $1,980 per ounce. Trading in this market may be difficult as well as unexciting, but there is a silver lining. Prices have so far not broken down below the $1,900 level, which is building fresh support at this price. Despite the Fed’s hawkish position on monetary policy, the bond yields holding above 4% and the U.S. dollar index near a six-month high above 105 points, the gold market appears unaffected and remains resilient above the August lows. One of the reasons for gold’s ability to withstand the assault of higher yields and the U.S. dollar is that central banks continue to buy substantial quantities of gold. Data from the World Gold Council, the central banks of Poland, Czechia, and India extended their months-long buying spree in August. The National Bank of Poland dovetails Singapore and China as the third-largest gold buyer this year. The central banks constitute a significant demand factor in the gold market, making it difficult to be bearish on this precious metal.

The spot market for precious metals moved up this week. Gold climbed by 0.25% from last week’s close at $1,919.08 to end this week at $1,923.91 per troy ounce. Silver ascended by 0.48% from the previous week’s closing price of $22.93 to this week’s closing price of $23.04 per troy ounce. Platinum, which closed last week at $896.60, ended this week at $929.69 per troy ounce to gain by 3.69%. Palladium came from its price last week at $1,199.23 to end this week at $1,250.89 per troy ounce for an upward leap of 4.31%. The three-month LME prices of industrial metals also moved up collectively. Copper, which closed last week at $8,242.50, ended this week at $8,417.50 per metric ton for a gain of 2.12%. Zinc was worth $2,443.50 last week and this week was worth $2,570.00 per metric ton, thus gaining 5.18% for the week. Aluminum closed last week at $2,183.50 and this week at $2,224.50 per metric ton, rising by 1.88%. Tin closed the previous week at $25,573.00, while its closing price this week was $25,895.00 per metric ton for a gain of 1.26%.

Energy and Oil

A string of positive macroeconomic reports on China suggesting that both manufacturing output and retail sales grew by 4.5-4.6% year-on-year triggered a bull run in oil prices that continued throughout this week. The new data surpassed analysts’ expectations and buoyed investor expectations in the oil market that a resumption of China’s economic recovery will enhance the demand for crude and other energy sources. Chinese refinery runs reached an all-time high in August at 15.23 million barrels per day (b/d), transforming the country from an underperforming bearish factor to the largest bullish upside for oil prices.

Demand optimism was lifted by the news from China despite both Europe and the United States struggling with refinery maintenance. Furthermore, OPEC reiterated its bullish outlook for 2024 oil demand, forecasting that it will rise by 2.24 million b/d on the back of a faster economic recovery in major economies. The outlook overrides the concerns regarding high-interest rates and elevated inflation, with global GDP growth forecasted to come in at 2.5% next year.

Natural Gas

The U.S. exported a record volume of natural gas in the first half of this year than in any other previous semi-annual period. It averaged 12.5 billion cubic feet per day (Bcf/d), exceeding the same period in 2022 by 11%. In May, U.S. natural gas exports as liquefied natural gas (LNG) and by pipeline averaged a monthly record high of 13.6 Bcf/d. Since 1957, the U.S. once more became a natural gas net exporter (i.e. natural gas exporters exceeded natural gas imports) for the first time in 2017, due primarily to increased LNG exports.

For the report week starting Wednesday, September 6, and ending Wednesday, September 13, the Henry Hub spot price rose by $0.27 from $2.49 per million British thermal units (MMBtu)to $2.76/MMBtu. The price of the October 2023 NYMEX contract increased by $0.17, from $2.510/MMBtu at the start of the report week to $2.680/MMBtu by the week’s end. The price of the 12-month strip averaging October 2023 through September 2024 futures contracts rose by $0.032 to $3.240/MMBtu.  

International natural gas futures prices ascended this report week. the weekly average front-month futures prices for liquefied natural gas (LNG) cargoes in East Asia increased by $0.10 to a weekly average of $13.36/MMBtu. Natural gas futures for delivery at the Title Transfer Facility (TTF) in the Netherlands, the most liquid natural gas market in Europe, increased by $0.23 to a weekly average of $10.98/MMBtu. In the week last year corresponding to this week (i.e., from September 7 to September 14, 2022), the prices were $53.19/MMBtu in East Asia and $60.81/MMBtu at the TTF.

World Markets

European equities ended higher this week, with the pan-European STOXX Europe 600 Index gaining by 1.60%. Germany’s DAX gained by 0.94%, France’s CAC 40 Index climbed by 1.91%, and Italy’s FTSE MIB surged by 2.35%. The UK’s FTSE 100 Index jumped by 3.12%, helped by the depreciation of the UK pound versus the U.S. dollar. A decline in the pound translates to higher earnings for dollar-earning multinational companies listed on the exchange that generate overseas revenue. Investor sentiment also appeared to have been lifted by better economic data out of China indicating that it has resumed its path towards economic recovery, and Europe’s as well. While the European Central Bank (ECB) raised interest rates, it nevertheless signaled that borrowing costs may have reached a peak. The ECB raised interest rates for the 10th consecutive time. The ECB president proclaimed that a “solid majority” of policymakers backed the quarter-point rate hike that took the key deposit rate to a record high of 4.0%. The interest rate has reached a level that will return inflation to the target if maintained for a sufficiently long duration.

Japan’s stock markets rose during the week. The Nikkei 225 Index climbed by 2.8% while the broader TOPIX Index surged by 2.9%. Investor optimism was helped by good news about China’s macroeconomic situation, dispelling the uncertainty about the impact of the country’s stimulus efforts on its economic growth and markets. The strong U.S. bourses and the weakness in the yen also drove the stock markets, since a weak currency is perceived to be beneficial to Japan’s export industry. The Bank of Japan’s (BoJ’s) governor suggested that the central bank could have sufficient data by the end of the year to determine if wages will continue to rise and lead to the end of the policy of negative interest rates. Japan’s policy is anchored on the principle that sustained wage growth is key to the achievement of the country’s inflation target of 2%. While Gov. Kazuo Ueda was careful to stress that policy normalization is still some distance away, his comments were perceived as hawkish by investors. They were also taken to be a verbal intervention in response to the historic weakness in the yen.

Chinese stock markets ended mixed in reaction to official indicators that revealed that the country’s economy may have bottomed despite data also pointing to ongoing weakness in the property market. The Shanghai Composite Index moved sideways with neither gain nor loss for the week while the blue-chip CSI 300 Index slid down by 0.83%. The Hang Seng Index, Hong Kong’s benchmark, gave up 0.1%. The official data for August indicated that the country was well on its way towards economic stabilization. Indicators of industrial production and retail sales grew more than forecast last month from a year ago. Unemployment fell unexpectedly from July. On the other hand, fixed-asset investment growth fell short of forecasts because of a steeper decline in real estate investment. New bank loans rose higher than the consensus estimate, topping RMB 1.36 trillion in August. This was higher than July’s RMB 345.9 billion. Corporate demand largely drove credit expansion, while household and longer-term loans also grew.

The Week Ahead

Included in the important economic data expected to be released next week are the FOMC meeting, housing and home builder data, and preliminary S&P Global PMI data for September.

Key Topics to Watch

  • Home builder confidence index
  • Housing starts
  • Building permits
  • Fed interest rate decision
  • Fed Chair Powell press conference
  • Initial jobless claims
  • Philadelphia Fed manufacturing survey
  • U.S. current account deficit
  • U.S. leading economic indicators
  • Existing home sales
  • Fed Gov. Lisa Cook speaks
  • S&P flash U.S. services PMI
  • S&P flash U.S. manufacturing PMI
  • Minneapolis Fed President Neel Kashkari speaks
  • San Francisco Fed President Mary Daly speaks

Markets Index Wrap Up

Weekly Market Review – September 9, 2023

Stock Markets

The holiday-shortened week ended lower across all the major indexes as Monday saw the markets closed in observance of the Labor Day holiday. According to the WSJ Markets report, the Dow Jones Industrial Average (DJIA) slipped 0.75% down as the DJ Total Stock Market Index gave up double that with a loss of 1.47%. The broad-based S&P 500 Index descended by 1.29% while the technology-heavy Nasdaq Stock Market Composite declined by 1.93%. The investor risk perception indicator, CBOE Volatility Index, rose by 5.73%. The dip in equities may be a technical correction from the previous week’s gains, but it is also driven by positive economic signals that sent interest rates higher. Growth stocks outperformed value shares, while large-cap counters fared better than small-caps by a wider margin.

A decline in Apple’s share price accounts for the deeper slump in the Nasdaq compared to the broader indexes. Apple’s sell-down was precipitated by news that Chinese government employees would henceforth be forbidden from using iPhones. Another source of discouragement for investors is reports that the upcoming iPhone15 will have a much higher tag price than current models. Also weighing down on the indexes were declines in NVIDIA and other chipmakers.   

U.S. Economy

While the week’s economic calendar was not especially heavy this week, the released reports seemed to drive investor sentiment by generally surprising on the upside. The Institute for Supply Management’s report on August services sector activity appeared to stand out as the main market mover. It shows that the services sector activity for that month jumped unexpectedly to its highest level since February. According to the report, new orders were growing at a faster pace but inventories had risen considerably as order backlogs fell sharply. Export orders likewise remained robust, despite the growing worries through the week about a sharp slowdown in the Chinese economy.

The data that emerged this week also showed that productivity rose by 3.5% last quarter which is the strongest productivity growth rate since 2020. If the distortions from the pandemic are excluded, the productivity rate registered was the highest reading since the third quarter of 2017. Stronger productivity should drive upward support to GDP, particularly when occurring simultaneously with growth in the labor force, as the next section shows. Rising productivity can exert a dampening effect on inflation, especially in a moderating wage-growth environment as is the case at present. This confluence of economic factors could actually help the Fed in pausing and possibly reversing the recent interest rate hikes.

The weekly jobless claims report that was released on Thursday came in lower than expected. This suggested that the strength in labor demand continues despite the solid increase in the unemployment rate from 3.5% to 3.8% in August. The number of Americans applying for unemployment in the previous week, which was expected to increase slightly, fell to 216,000, its lowest level in six months. Continuing claims fell to its lowest level since mid-July at 1.58 million. The jobless numbers triggered an increase in short-term bond yields. The yield on the two-year U.S. treasury note briefly returned above the 5% threshold on Thursday afternoon.

Metals and Mining

Most traders are focused on trading the top two precious metals, gold and silver, but they tend to ignore the precious metal that may be one of the most essential in the coming decade. Platinum has a growing potential overlooked by many, as industrial demand for it continues to grow in an environment where supply growth is stagnating. The market faces a deficit of one million ounces this year while total platinum demand in the second quarter this year increased by 27% compared to the second quarter of last year. At the same time, automotive demand rose by 19% compared to last year, according to the latest estimates from the World Platinum Investment Council. The automotive sector represents about 80% of global platinum demand. This precious metal is a critical element in catalytic converters, which are used to reduce harmful emissions in diesel and gasoline-powered engines.

The spot prices of precious metals fell across the board this week. Gold came from $1,940.06 last week and ended at $1,919.08 per troy ounce this week for a loss of 1.08%. Silver, which ended at $24.19 one week ago, closed at $22.93 per troy ounce this week for a drop of 5.21%. Platinum descended by 6.98% this week from last week’s e at $963.85 to end at $896.60 per troy ounce. Palladium lost 1.85% of its value from the previous week’s closing price of $1,221.87 to this week’s closing price of $1,199.23 per troy ounce. The three-month LME prices of base metals also took a dive over this week. Copper came from $8,500.50 last week to end at $8,242.50 per metric ton this week for a decline of 3.04%. Zinc, which closed last week at $2,485.50, ended this week at $2,443.50 per metric ton for a drop of 1.69%. Aluminum came from last week’s price of $2,237.00 to end this week at $2,183.50 per metric ton, registering a slide of 2.39%. Tin descended from its price last week of $25,806.00 to this week’s price of $25,573.00 per metric ton, a decline of 0.90%.

Energy and Oil

Weaker-than-expected macroeconomic data from China capped market sentiment earlier this week. However, firm support for ICE Brent to stay at around $90 per barrel was provided by the fourth consecutive crude inventory draw in the United States combined with another week-on-week drop in gasoline stocks. Global balances were not materially altered by the extension of Saudi and Russian supply and export cuts until December 2023. However, it reiterates the bullish narrative of light supply further down the road. In the meantime, the Biden administration canceled the last remaining oil and gas leases along the coast of the Arctic National Wildlife Refuge. Much to the ire of the Alaskan authorities, the administration claimed that the Trump-era lease sales were “seriously flawed” and were based on legal deficiencies.

Natural Gas

For the week spanning August 30 to September 6, 2023, the Henry Hub spot price remained flat at $2.49 per million British thermal units (MMBtu). Regarding the Henry Hub futures price, the price of the October 2023 NYMEX contract decreased by $0.286, from $2.796/MMBtu at the start of the week to $2.510/MMBtu at the week’s end. The price of the 12-month strip averaging October 2023 through September 2024 futures contracts declined by $0.138 to $3.208/MMBtu. The NYMEX January 2024 contract reflects a premium of about $1.17/MMBtu to the October 2023 contract.

The international natural gas futures prices decreased this report week. The weekly average front-month futures prices for liquefied natural gas (LNG) cargoes in East Asia decreased by $0.07 to a weekly average of $13.26/MMBtu. Natural gas futures for delivery at the Title Transfer Facility (TTF) in the Netherlands, the most liquid natural gas market in Europe, decreased by $0.46 to a weekly average of $10.75/MMBtu. The corresponding prices last year (for the week ending September 7, 2022) to this week’s prices were $56.07/MMBtu in East Asia and $66.49/MMBtu at the TTF.

World Markets

The pan-European STOXX Europe 600 Index closed lower by 0.76% this week on concerns that elevated interest rates may push the economy into a slowdown and eventually a recession. Among the major stock indexes, Italy’s FTSE MIB slumped by 1.46%, France’s CAC 40 Index declined by 0.77%, and Germany’s DAX descended by 0.63%. The UK’s FTSE 100 Index bucked the general trend and rose by 0.18%. The yields on German and Italian 10-year sovereign bonds inched higher amid worries about the eurozone economy. The yield on the 10-year government bond in the U.K. ended higher but pulled back from the highs it attained midweek. A series of economic data provided more indications that the eurozone economy continues to incur obstacles. The gross domestic product (GDP) in the bloc ticked up by 0.1% in the second quarter while a drop in exports contributed to Eurostat’s downward revision of its initial estimate of 0.3% expansion. Weaker automotive fuel purchases were reflected in the drop in retail sales volumes in the eurozone by 0.2% sequentially in July. The year-over-year decline was 1.0%.

Japanese bourses were mixed this week. The Nikkei dipped by 0.3% while the broader TOPIX gained by 0.4%. Investor risk appetite was weighed down by worries about China’s economic slowdown and the impact on global demand. Japan’s economy may not be doing as well as originally thought as suggested by some weak economic data releases. Further dampening sentiment was a downward revision made to second-quarter economic growth. Japan’s second-quarter 2023 gross domestic product expanded by 4.8% quarter-on-quarter on an annualized basis, which is weaker than the 6,0% growth estimated preliminarily. Also coming in softer than anticipated were capital spending, private consumption, and public investment. The yield on the 10-year Japanese government bond (JGB) remained steady at around the 0.6% range. The yen weakened to around JPY 147 per U.S. dollar, its lowest level in more than 10 months, from the JPY 146 at the end of the earlier week. This prompted Japan’s Ministry of Finance to issue its strongest warnings to date on foreign exchange market intervention to prop up the end.

Chinese stocks fell back this week as the latest economic indicators confirmed speculation about the country’s weakening outlook. The Shanghai Composite Index declined by 0.53% while the blue-chip CSI 300 Index descended by 1.36%. The Hong Kong benchmark Hang Seng Index fell for the week that ended Thursday as financial markets were closed on Friday due to a heavy rainstorm that flooded the city. The private Caixin/X&P Global survey or services activity dropped to 51.8 in August which is below the forecast and July’s 54.1. The gauge remains above eh 50 threshold, indicating expansion for the eighth consecutive month,

 but it was the slowest increase since December, the outcome of the poor demand that is dragging China’s economy down further. The indicator is broadly consistent with the prior week’s nonmanufacturing Purchasing Managers’ Index (PMI), which also slowed to its lowest level his year. The official nonmanufacturing PMI remained in contraction for the fifth consecutive month but came in slightly above expectations. China’s trade fell by 8,8% in August from one year earlier, somewhat moderating from the sharp 14.5% drop in July. Imports shrank by 7.3%, and both readings were above expectations, suggesting that some sectors in China’s economy may be rounding the bottom. China’s renminbi currency fell to a record low of 7.36 against the U.S. dollar in overseas trading after the central bank set its yuan fixing rate at a two-month low.

The Week Ahead

Among the important economic data expected this week are the retail sales data, the CPI inflation report, and capacity utilization.

Key Topics to Watch

  • Consumer price index
  • Core CPI
  • CPI (year-over-year)
  • Core CPI (year-over-year)
  • Initial jobless claims
  • Producer price index
  • Core PPI
  • PPI (year-over-year)
  • Core PPI (year-over-year)
  • U.S. retail sales
  • Retail sales minus autos
  • Business inventories
  • U.S. import prices
  • Empire State manufacturing survey
  • Industrial production
  • Capacity utilization
  • Consumer sentiment (prelim)

Markets Index Wrap Up

Weekly Market Review – September 2, 2023

Stock Markets

Major indexes are up this week, helped by hopeful signs on the inflation front, although this was the first month since February that stocks closed negative. The Dow Jones Industrial Average (DJIA) gained 1.43% while the DJ Total Stock Market Index almost doubled this gain by moving up by 2.75%. The broad S&P 500 Index climbed 2.50% and technology-heavy Nasdaq Stock Market Composite surged by 3.25%. The NYSE Composite ascended by 2.06% and the Russell 1000 went up by 2.68%. The CBOE Volatility Index which tracks investor risk perception declined by 16.52%.

Growth shares were boosted by a decrease in longer-term interest rates over much of the week which reduced the implied discount on future earnings. The significant year-to-date gap between large caps and smaller cap stocks which outperformed this week. Many observers noted that during the week, bad news for the economy was considered good news for stock prices because of the interest rate implications. The big market push came Tuesday when the S&P 500 Index recorded its best one-day gain since June. On that day, job quits were announced to have considerably fallen. Markets are scheduled to be closed on Monday, September 4, in observance of the Labor Day holiday.

U.S. Economy

The Labor Department reported that job openings unexpectedly fell by 338,000 in July, hitting their lowest level since March 2001. As mentioned earlier, job quits, which are considered by some to be a more reliable indicator of the strength of the labor market, fell significantly. The unemployment rate hit its highest in 17 months. The closely watched nonfarm payrolls report released on Friday appeared to confirm loosening labor market conditions. Employers added 187,000 jobs in August which is slightly above consensus expectations; however, gains for the previous two months were revised lower by a total of 110,000. Average hourly earnings came in somewhat below expectations, increasing by only 0.2% for the month.

Most importantly, the unemployment rate ticked up from 3.5% to 3.8%, its highest level since February 2022. The labor force participation rate hit 62.8%, its highest level since the start of the pandemic in February 2020, as 736,000 people reentered the job market. Despite the slowdown in the labor market, people appeared to grow hopeful for a “no landing scenario,” that the economy would escape even a substantial slowdown in 2023. The Commerce Department reported on Thursday that personal spending jumped by 0.8% in July. This is above expectations and well above a 0.2% increase in consumer prices during the month. Then on Friday, the Institute for Supply Management reported that its gauge of manufacturing activity climbed unexpectedly to its best level since February, although it still indicated a contraction in the sector. Also surprising on the upside was a gauge of overall business activity in the Chicago region. 

Metals and Mining

While gold appears to show relative strength despite facing significant headwinds from rising bond yield and the U.S. dollar, the precious metals market continues to lack a catalyst that can drive gold back to the $2,000-per-ounce level and, hopefully after that, record highs. Gold prices hit a brick wall at $1,980 per ounce heading into the long weekend holiday. This level is a critical psychological level in gold’s long-term uptrend. So far, gold is stuck in a neutral trading channel, but it appears that when the right conditions have been met, gold has the potential to move northward. In the week just ended, some cracks appear to be forming in the U.S. labor market, an essential pillar of strength for the economy so far this year.

The precious metals spot market ended mixed for the week. Gold gained by 1.31% from its previous price of $1,914.96, closing at $1,940.06 per troy ounce this week. Silver, which closed at $24.23 the week before, ended this week at $24.19 per troy ounce which is slightly down by 0.17%.  Platinum ended this week at $963.85 per troy ounce, 1.63% higher than the previous week’s closing price of $948.43. Palladium, which ended the previous week at $1,227.74, closed this week at $1,221.87 per troy ounce, for a loss of 0.48%. The three-month LME prices of industrial metals were also mixed. Copper closed at $8,500.50 per metric ton, 1.69% higher than the previous week’s price of $8,359.50. Zinc, which ended one week ago at $2,394.00, closed this week at $2,485.50 per metric ton for a weekly gain of 3.82%.  Aluminum gained by 3.68% from its previous price of $2,157.50 to close the week at $2,237.00 per metric ton. Tin ended the week at $25,806.00 per metric ton for a loss of 0.25% from the previous week’s closing price of $25,870.00.        

Energy and Oil

An unusually tight oil market in the United States has resulted from continuous U.S. stock draws equivalent to a one million barrel per day decline over the past five weeks. This added upward pressure to oil prices despite the country’s economic woes. Adding to the bullish sentiment are widespread expectations of OPEC+ extending production and export cuts as well as recovering Chinese manufacturing activity adding to the demand. These pressures have pushed ICE Brent above the $87 per barrel price level. According to Russia’s deputy price minister Alexander Novak, OPEC+ members have agreed on the main parameters of production over the upcoming months but will only announce it next week. This suggests that Riyadh and Moscow are to continue their production and export cuts.

Natural Gas

For the report week beginning Wednesday, August 23, and ending Wednesday, August 30, 2023, the Henry Hub spot price fell by $0.10 from $2.59 per million British thermal units (MMBtu) to $2.49/MMBtu. Regarding the Henry Hub futures price, the September 2023 NYMEX contract expired Tuesday at $2.556/MMBtu, up by $0.06 for the week. The October 2023 NYMEX contract price increased to $2.796/MMBtu, up by $0.20 through the week. The price of the 12-month strip averaging October 2023 through September 2024 futures contracts rose by $0.05 to $3.345/MMBtu.

International natural gas futures prices decreased for this report week. The weekly average front-month futures prices for liquefied natural gas (LNG) cargoes in East Asia decreased by $0.76 to a weekly average of $13.33/MMBtu. Natural gas futures for delivery at the Title Transfer Facility (TTF) in the Netherlands, the most liquid natural gas market in Europe, decreased by $1.13 to a weekly average of $11.22/MMBtu. During the week last year that corresponds to this week (i.e., the week from August 24 to August 31, 2022), the prices were $64,02/MMBtu in East Asia and $83.62/MMBtu at the TTF, the highest weekly average TTF price on record. Due to uncertainty about Australian LNG supplies amid the potential for labor stoppages, international natural gas prices have been volatile throughout August.

World Markets

European stock prices rose for the week reflecting investors’ optimism that interest rates would soon peak and that a recession, while still possible, would be short-lived and shallow. Equities rose on positive news of China’s efforts to bolster its beleaguered economy.  The pan-European STOXX Europe 600 Index climbed by 1.49%. Major European stock indexes in the UK, Germany, Italy, and France also advanced for the week. As core inflation data and comments from policymakers suggested that the European Central Bank (ECB) could be nearing the end of its monetary policy tightening cycle, European government bond yields edged further downward. The yields on the 10-year government bonds issued by France and Germany inched lower as did the yield on UK 10-year sovereign bonds which descended close to one-month lows on softer economic data.

Japan stock markets rose over the week. The Nikkei 225 Index rose by 3.4% while the broader TOPIX Index gained 3.7%. Expectations that the U.S. Federal Reserve was moving closer to pausing its interest rate hiking cycle were boosted by weaker-than-forecasted U.S. economic data that emerged during the week. China’s latest measures to boost its markets and economy were likewise welcomed by investors. In the meantime, the yield on the 10-year Japanese government bond dipped to 0.63% from 0.64%, its level at the end of the previous week. Weighing on yields was the announcement by the Bank of Japan (BoJ) of its intention to conduct bond-buying operations one day before its auction of 10-year notes. This is scheduled for the week beginning September 4. The yen strengthened from JPY 146.4 against the dollar a week ago to JPY 145.4 this week. It remains historically weak, however, prompting speculation that Japan’s monetary authorities could intervene in the foreign exchange markets to prop up the currency.

After Beijing issued a series of stimulus measures aimed at reviving the economy, Chinese stocks rose for the week. The blue-chip CSI 300 Index and Shanghai Composite Index both advanced for the week. The Hong Kong benchmark Hang Seng Index also rose for the four-day week that ended Thursday. Financial markets were closed on Friday due to an approaching typhoon. On the Friday preceding, China’s bank reduced the amount of foreign currency deposits that domestic banks are required to hold as reserves. The foreign exchange reserve requirement ratio was reduced from 6.0% to 4.0%, effectively freeing up more foreign currency in the local market to buy the renminbi currency. This helped to support the local currency which in August had fallen to its lowest level against the U.S. dollar since 2007. The central bank issued its directive hours after China’s financial regulator announced that it would reduce minimum down payments for homebuyers nationwide. It encouraged lenders to lower rates on existing mortgages.

The Week Ahead

This coming week, important economic data scheduled for release include the July factory orders, the Fed Beige Book, and the ISM Services PMI report for August.

Key Topics to Watch

  • Factory orders
  • U.S. trade deficit
  • S&P final U.S services PMI
  • ISM services
  • Fed Beige Book
  • Initial jobless claims
  • U.S. productivity (revision)
  • Unit-labor costs (revision)
  • Philadelphia Fed President Patrick Barker speaks
  • Chicago Fed President Austan Goolsbee speaks
  • New York Fed President John Williams speaks
  • Atlanta Fed President Raphael Bostic speaks (Sept. 7, 3:45 p.m.)
  • Atlanta President Raphael Bostic speaks (Sept. 7, 7 p.m.)
  • Dallas Fed President Lorie Logan speaks
  • Wholesale inventories
  • San Francisco Fed President Mary Daly speaks
  • Consumer credit

Markets Index Wrap-Up

Weekly Market Review – August 26, 2023

Stock Markets

The Dow Jones Industrial Average (DJIA) moved marginally lower this week by 0.45% although the DJ Total Stock Market inched higher by 0.72%. The broad S&P 500 Index also gained by 0.82% with small caps losing ground and midcaps gaining. The technology-heavy Nasdaq Stock Market Composite surged by 2.26% while the NYSE Composite moved up by 0.11% and the Russell 1000 by 0.79%. The CBOE Volatility Index, which tracks investor risk perception, declined by 9.36%, according to data from the WSJ Markets.

The Federal Reserve’s pronouncement in this week’s annual Jackson Hole symposium about future interest rate hikes remained hawkish but was noticeably more balanced than last year. This was seen as catering favorably for equities and bonds, although uncertainty remains concerning what policy measures are still needed to deal with the higher-than-target inflation readings. Powell conveyed that the Fed remains committed to defeating inflation even though it may cause “some pain” for U.S. households. His message was somewhat more nuanced, however, emphasizing that future Fed decisions will be based on the data, indicating that the policy-making body is keeping its options open. The Fed’s mixed signals muted trading for the week.

Growth stocks outperformed value shares this week as investors responded to substantial earnings and revenue reports by artificial intelligence chipmaker NVIDIA. Earlier in the week, financials pulled back after S&P Global downgraded its credit rating of five regional banks. The downgrade was, in part, due to stresses in the commercial real estate lending market. A generally cautious picture regarding the health of the U.S., consumer market was painted by second-quarter results reported by some retailers. Department store operator Macy’s shares fell sharply as a result of reporting a drop in earnings and warned of growing consumer caution coupled with rising credit card delinquencies. Nordstrom, Macy’s competitor, also reported rising late payments on its credit cards in issuing a cautious outlook, although their realized earnings and revenues beat estimates. Nordstrom, specialty retailer Dick’s Sporting Goods, and discount chain Dollar Tree all noted that earnings suffered due to exceptionally high levels of theft from their stores.

U.S. Economy 

According to the Fed, economic growth remains more resilient even by their own expectations, although some downside is still expected in reaction to the impact of past, and possibly future, rate hikes through the economy. Policy rates are likely nearing or at their peak. In the meantime, the durable goods orders data released on Thursday indicated that a somewhat higher degree of business caution was prevalent in some areas. Durable goods orders excluding defense and transportation, a commonly accepted proxy for business investment, rose by 0.1% in July although it was more than offset by a downwardly revised 0.4% contraction in June.  S&P Global’s index of manufacturing activity also fell more than expected in August. This indicator reversed most of July’s strong gain and moved further back into contraction territory.

Despite the highest mortgage rates in years, the housing sector appeared more robust with new home sales ascending to their highest level in July since early 2022. On Thursday, Freddie Mac reported that the 30-year fixed rate mortgage had reached its highest level since 2001. However, existing home sales declined and missed expectations. In the Jackson Hole, Wyoming Fed symposium, Powell admitted that the higher rates had slowed growth in wages and industrial production even as tightening bank lending standards were colling the economy. He noted that economic growth, on the other hand, remained above its longer-term trend. Furthermore, the housing sector also appeared to be regaining momentum after slowing sharply over the past one and a half years.

Metals and Mining

Despite the many challenges that faced the gold market, prices refuse to go lower, possibly indicating that strong support exists at current levels. Among the challenges was the increase in 10-year bond yields to its highest in 15 years. Higher bond yields traditionally bode ill for gold prices because they raise the opportunity cost of precious metals, a nonyielding asset. This week the gold market did see some initial weakness, but this was quickly dispelled as prices were looking to start the weekend with a 1% gain, ending four weeks of losses. Simultaneously, silver is ending the week up as it saw a modest short squeeze. Despite its current strength, however, it is unlikely that gold has the momentum to rally back to $2,000 per ounce anytime soon, with the Fed’s prevailing policy addressing stubborn inflation and a relatively tight labor market.

This week, the spot prices of precious metals ended mixed. Gold closed the week at $1,914.96 per troy ounce, up by 1.36% from last week’s close at $1,889.31. Silver ended at $24.23 per troy ounce, higher by 6.51% from the previous week’s close at $22.75. Platinum ended the week at $948.43 per troy ounce, higher by 3.70% from the previous week’s close at $914.58. Palladium bucked the trend to close at $1,227.74 per troy ounce, down by 2.37% from the earlier week’s close at $1,257.57. The three-month LME prices of industrial metals were generally up. Copper, which closed at $8,235.50 last week, rose by 1.51% to close at $8,359.50 per metric ton. Zinc, which ended one week ago at $2,298.00, closed this week at $2,394.00 per metric ton for a gain of 4.18%. Aluminum, which last traded at $2,145.50 last week, closed this week at $2,157.50 per metric ton for a gain of 0.56%. Tin gained 2.23% from the previous week’s close at $25,305.00 to this week’s close at $25,870.00 per metric ton.

Energy and Oil

Oil prices this week were weighed heavily down by rumors of a US-Venezuela rapprochement and the prospect of Kurdish oil exports returning to the market. However, some of the downward pressure was counter-balanced by healthy U.S. crude inventory draws and lower-than-expected product stock levels in Europe. The U.S. Federal Reserve’s Jackson Hole meeting this week also failed to surprise in either direction; therefore, in the absence of any major turns, oil prices ended the week sideways with another very minor weekly loss.

Natural Gas

In the first six months of 2023, the U.S. exported more liquefied natural gas (LNG) than any other LNG-exporting country in the world, according to data from CEDIGAZ. the increase in LNG exports from the U.S. was mostly due to Freeport LNG’s return to service and continued growth in global LNG demand, particularly in Europe. Following the U.S. was Australia as the world’s second-largest exporter. The European Union (EU 27 plus the UK) reprised its 2022 position as the main destination for U.S. LNG in the first half of 2023, accounting for 67% of total U.S. exports which increased by 14% over the 2022 annual average. The Netherlands, the U.K., France, Spain, and Germany accounted for 77% of total U.S. LNG exports to Europe.

For this report week from August 16 to August 23, 2023, the Henry Hub spot price rose by $0.04, from $2.55 per million British thermal units (MMBtu) to $2.59/MMBtu. The price of the September 2023 NYMEX contract decreased by $0.095 from $2.592/MMBtu at the start of the week to $2.497/MMBtu at the end of the week. The price of the 12-month strip averaging September 2023 to August 2024 futures contracts descended by $0.115 to $3.224/MMBtu.

International natural gas futures prices increased for this report week. The weekly average front-month future prices for LNG cargoes in East Asia increased by $2.33 to a weekly average of $14.09/MMBtu. Natural gas futures for delivery at the Title Transfer Facility (TTF) in the Netherlands, the most liquid natural gas market in Europe, increased by $0.60 to a weekly average of $12.35/MMBtu. In the week in 2022 that corresponded to this week (August 17 to August 24, 2022), the prices were $59.01/MMBtu in East Asia and $77.60/MMBtu at the TTF.

World Market

In Europe, there was some optimistic macroeconomic news that incentivized investors to push stock prices higher. The pan-European STOXX Europe 600 Index inched up by 0.66% as expectations grew that interest rates may soon peak and European natural gas prices dropped. The major stock indexes in the region generally ended higher. Italy’s FTSE MIB advanced by 1.61%, France’s CAC 40 Index ascended by 0.91%, and Germany’s DAX climbed by 0.37%. The UK’s FTSE 100 Index gained by 1.05%. Eurozone bond yields declined and the 10-year German sovereign yields closed lower. Economic data indicated that the European economy was weakening, leading to growing expectations in the financial markets that future interest rates would not increase much further.

Japanese stocks rose this week as the market rallied from the declines of the previous week to chalk up four consecutive days of gains before giving up much of the gains in Friday’s trading. The broad TOPIX ended up 1.3% while the benchmark Nikkei 225 closed the week higher by 0.6%. Japanese investors appeared unaffected by a softer-than-hoped-for policy response from China to address their slowing growth and a building property crunch. Encouraging domestic data announcements further buoyed the markets. Both manufacturing and services sector activity combined to bring flash composite PMI data to increase to 52.6 in August, up from 52.2 in July. While Japan’s factory activity declined for a third consecutive month in August, the data shows that the rate of decline was decelerating. A 3.1% rise in Japan’s core consumer prices in July was generally well received although various inflation readings during the week provided mixed messages. The yen continued to weaken against the dollar, a trend that prevailed over recent months. This week it finished in the low JPY 146 range against the U.S. dollar, which is close to levels reached in September-October 2022, prompting intervention from the Bank of Japan.

Chinese stocks ended lower for the week in line with growing investor pessimism about the country’s economic outlook. The Shanghai Composite Index as well as the blue-chip CSI 300 Index both suffered weekly declines, adding to their year-to-date losses. The Shanghai Composite Index is at its lowest level since December of last year, while the CSI 300 Index is trading at its lowest level since November 2022. The Hang Seng Index, Hong Kong’s benchmark which entered a bear market Friday of the preceding week, retraced to end up marginally higher for the week, although it also is at its lowest level since November. Several factors contributed to an erosion of confidence in China’s economy, among which are disappointing domestic economic data, signs of deflation, record youth unemployment, and continued liquidity problems in the debt-laden property sector. The specter of accelerated capital outflows is being raised by signs of deteriorating growth and a sense that Beijing has relatively few good options to arrest the downturn. Over the 13 trading days through Wednesday, overseas funds sold the equivalent of US $10.7 billion from the mainland market. However, the risks of a systemic crisis emanating from China’s property sector appear low.   

The Week Ahead

Among the important economic data scheduled for release this week are the July PCE inflation report, the August unemployment rate, and nominal personal income and spending.

Key Topics to Watch

  • S&P Case-Shiller home price index (20 cities)
  • Job openings
  • Consumer confidence
  • ADP employment
  • GDP (revision)
  • Advanced U.S. trade balance in goods
  • Advanced retail inventories
  • Advanced wholesale inventories
  • Pending home sales
  • Initial jobless claims
  • Personal income (nominal)
  • Personal spending (nominal)
  • PCE index
  • Core PCE index
  • PCE (year-over-year)
  • Core PCE (year-over-year)
  • Chicago Business Barometer
  • U.S. nonfarm payrolls
  • U.S. unemployment rate
  • U.S. hourly wages
  • Hourly wages year-over-year
  • ISM manufacturing
  • Construction spending

Markets Index Wrap Up

Weekly Market Review – August 19, 2023

Stock Markets

Stocks fell over the week sending all the major indexes downward. The Dow Jones Industrial Average (DJIA) slumped by 2.21%, not far from the DJ Total Stock Market’s 2.24% drop. The broad-based S&P 500 Index declined by 2.11% while the technology-heavy Nasdaq Stock Market Composite fell even further by 2.59%. The NYSE Composite Index descended by 2.44%. Not surprisingly, the risk indicator CBOE Volatility Index rose by 16.58%. Part of the decline may be accounted for as part of a healthy pullback strategy, although there is no doubt that sentiment was affected by developments in the geopolitical environment and a recalibration in investors’ realistic economic expectations due to the recent optimistic economic news losing steam.

This is the third consecutive week that stocks ended lower. Investor sentiment was apparently dampened by a sharp increase in longer-term bond yields and concerns that China is facing a sharp economic slowdown. The S&P 500 Index has closed the week down by 5.15% from its intraday peak on July 26. Although growth shares should weaken the most in theory in reaction to rising rates placing a greater discount on future earnings, they are instead holding up moderately better than value stocks, as shown by the Russell 1000 Growth Index. Small-cap stocks underperformed the rest of the market. According to traders, the market’s swing appeared to have been accentuated by program trading, technical factors, and thin summer trading. Nevertheless, shifting expectations for the economy will likely continue to drive market movements for the second semester of 2023.

U.S. Economy

The sharp rise in inflation rates the economy has experienced since 2022 appears to be tapering off, which means that it is unlikely that the Federal Reserve will resume its policy of increasing interest rates to keep inflation under control. The focus of economic and monetary policymakers has shifted from increasing inflation to slowing growth. In the year thus far, longer-term interest rates climbed significantly, causing the 10-year Treasury yield to hit a new high for the year in the past week. It appears that there is a resiliency in economic growth prompting the market to accept that the Fed may continue to raise interest rates in the future, which resulted in the record high reached by the 10-year Treasury yield last week.  

While household spending may slow as the year heads towards its end, this does not spell a significant retreat in consumer spending from the market altogether. The likelihood of a rolling recession is still intact, which means different areas of the economy will alternate in their slowdown which will result in a mild deceleration in the overall GDP. Spending remained strong in July, according to the recent retail sales report, although the underlying trends showed that sending habits are shifting. Sales of household furnishings, including furniture and appliances, vehicles, electronics, and other large-ticket items, declined. If the economy can sidestep a hard recession, which is the likely outcome due to healthy employment conditions and strong consumer finances, then there appears no reason that the financial markets will return the steady gains it has made since the bear market bottomed out last year.

Metals and Mining

The metals market this week responded to the movements in other financial and commodities markets. On the last day of trading, gold prices hit another five-month low overnight as rising U.S. treasury yields and a rally in the U.S. dollar index created headwinds causing sellers to dominate in the gold and silver markets. Foreign markets also caused ripples as the Chinese economy continued to soften, prompting the country’s central bank to promise further stimulus measures and support the depreciating yuan. Meantime, minutes of the last FOMC meeting released on Wednesday afternoon sent signals that the Fed remains committed to reining in the U.S. inflation. The market read the minutes as leaning hawkish, causing the rise in U.S. treasury yields. However, gold closed slightly higher for the last trading day, ending nine consecutive daily declines and lower lows.

The spot prices of precious metals ended lower this week. Gold closed at $1,889.31 per troy ounce this week, down by 1.28% from its closing price of $1,913.76 the week before. Silver ended trading almost unchanged, from last week’s price of $22.69 to this week’s price of $22.75 per troy ounce, marginally up by 0.26%. Platinum dipped by 0.16% from last week’s closing price of $916.07 to this week’s closing price of $914.58 per troy ounce. Palladium, previously at $1,299.07, ended this week at $1,257.57 per troy ounce for a decline of 3.19%.

The three-month LME prices of industrial metals have also lost some ground for the week. Copper came from $8,386.00 the week before to $8,235.50 per metric ton this past week for a decline of 1.79%. Zinc, previously at $2,457.00, closed this week at $2,298.00 per metric ton, a descent of 6.47%. Aluminum closed this week at $2,145.50 per metric ton, lower by 2.65% from the earlier week’s closing price of $2,204.00. Tin, formerly at $26,885.00, descended by 5.88% to close the week at $25,305.00 per metric ton.

Energy and Oil

The upside for crude oil prices is no longer as clear as it was two weeks ago even though backwardation in oil markets reached the widest level since April and inventories are declining globally. Backwardation refers to the condition when the current price, or spot price, of crude is higher than prices trading in the futures market. The recent minutes of the FOMC meeting showed that the Fed members were divided over the need for further rate hikes, thereby cautioning against market hopes of a soft recession. Furthermore, Chinese economic woes were again resurrected, causing Brent to move lower week-on-week to end at $84 per barrel.  

Natural Gas

For the report week from Wednesday, August 9, to Wednesday, August 16, 2023, the Henry Hub spot price fell by $0.36 from $2.91 per million British thermal units (MMBtu) – its highest price since January 2023 – to $2.55/MMBtu, aligning with the decline in the Henry Hub futures price. The price of the September 2023 NYMEX contract decreased by $0.367 from $2.959/MMBtu to $2.529. The price of the 12-month strip averaging September 2023 through August 2024 futures contracts declined by $0.133 to $3.340/MMBtu. Regarding regional spot prices, natural gas spot prices fell at most locations during this report week, except in Southern California. Price changes this week ranged from an increase of $2.85/MMBtu at SoCal Citygate to a decrease of $0.42/MMBtu at Sumas on the Canada-Washington border.

International natural gas futures prices increased this report week. The weekly average front-month futures prices for liquefied natural gas (LNG) cargoes in East Asia increased by $0.78 to a weekly average of $11.76/MMBtu. Natural gas futures for delivery at the Title Transfer Facility (TTF) in the Netherlands, the most liquid natural gas market in Europe, increased by $1.40 to a weekly average of $11.75/MMBtu. During the week last year corresponding to this report week (the week from August 10 to August 17, 2022), the prices were $49.94/MMBtu and $65.07/MMBtu in East Asia and at the TTF, respectively.

World Markets

Stocks fell in Europe due to growing fear of growing uncertainty surrounding China’s economic outlook as well as the likelihood of a prolonged elevated interest rate regime in Europe. The pan-European STOXX Europe 600 Index plunged by 2.34%, while major stock indexes likewise softened. Germany’s DAX declined by 1.62%, Italy’s FTSE MIB lost 1.81%, and France’s CAC 40 Index gave up by 2.40% for the week. The UK’s FTSE Index plummeted by 3.48%. UK’s markets reacted to the report of wage growth accelerating, thus bolstering the perception that inflation rates will again increase. This exerted further pressure on the Bank of England (BoE) to further raise interest rates.to put the arrest a possibly heating economy. Average weekly earnings (excluding bonuses) in the UK climbed by 7.8% in the three months through June from 7.4% in the three months through May. Services prices, which are seen by the BoE as the best predictor of underlying domestic inflation, speeded up to its highest level since March 1992 at 7.4%.

Japan’s stock markets declined over the week amid concerns regarding the broader impact of China’s macroeconomic weakness and its troubled property sector. The Nikkei 225 Index receded by 3.2% and the broader TOPIX Index fell by 2.9%. Tourism-related stocks led the shares whose prices declined most notably. The yield on the 10-year Japanese government bond (JGB) increased to 0.64% from 0.58%, its yield level at the end of the previous week. This was the result of the Bank of Japan’s (BoJ’s) monetary policy adjustment in July, the purpose of which was to allow JGB yields to more freely rise by turning its 0.5% yield ceiling from a rigid limit to a reference point. The yen softened to around HPY 145.5 versus the U.S. dollar, from its previous exchange rate of about JPY 144.9 the week earlier. Japanese authorities were prompted to intervene in the foreign exchange market in September 2022 to stem the currency’s decline when it traded at its lowest level in nine months. Meanwhile, Japan’s GDP grew by 6.0% quarter-on-quarter in the three months to the end of June 2023, driven largely by strong exports, and exceeding the 2.9% forecast by economists.

China’s equities succumbed to growing pessimism about the country’s flagging economic recovery. The Shanghai Stock Exchange Index dropped by 1.80% and the blue-chip CSI 300 fell by 2.58%. Hong Kong’s benchmark Hang Seng Index plunged by 5.89%, its biggest weekly fall in five months. According to official data for July, China’s economic activity continued to soften overall. Retail sales and industrial output advanced at a slower-than-expected rate in July compared to their readings one year ago. Also falling short of forecast was the fixed asset investment growth for the first seven months of 2023. Urban unemployment worsened slightly, edging up from June’s 5.2% to July’s 5.3%. New home prices in 70 of China’s largest cities fell by 0.23% in July from June, when they declined for the first time this year. Recent developments suggest that the strength of the recovery of China’s property sector may be faltering, and it may not sustain the growing stabilization it showed earlier this year.

The Week Ahead

The important economic data to be released in the coming week include the Purchasing Managers’ Index for services and manufacturing and the Michigan consumer sentiment survey.

Key Topics to Watch

  • Existing home sales
  • S&P flash U.S services PMI
  • S&P Flash U.S. manufacturing PMI
  • New home sales
  • Fed officials interviews from Jackson Hole summit
  • Initial jobless claims
  • Durable goods orders
  • Durable goods minus transportation
  • Powell gives opening speech at Jackson Hole summit
  • University of Michigan consumer sentiment final

Markets Index Wrap Up

error: Content is protected !!